Brazil crossed the 4,000,000 Covid-19 infection level with a death toll above 123,000, second in both categories only to the US. The nationwide lockdown resulted in a 9.7% GDP drop in the second quarter, following the 1.5% decrease in the first quarter. Therefore, Brazil entered a technical recession. Year-over-year, GDP for the first and second quarters decreased by 0.3% and plunged by 11.4%, respectively. The latter was the worst quarterly performance since record-keeping commenced in 1996. Despite the worse than forecast data, the USD/BRL resumed its correction with a new breakdown pending.
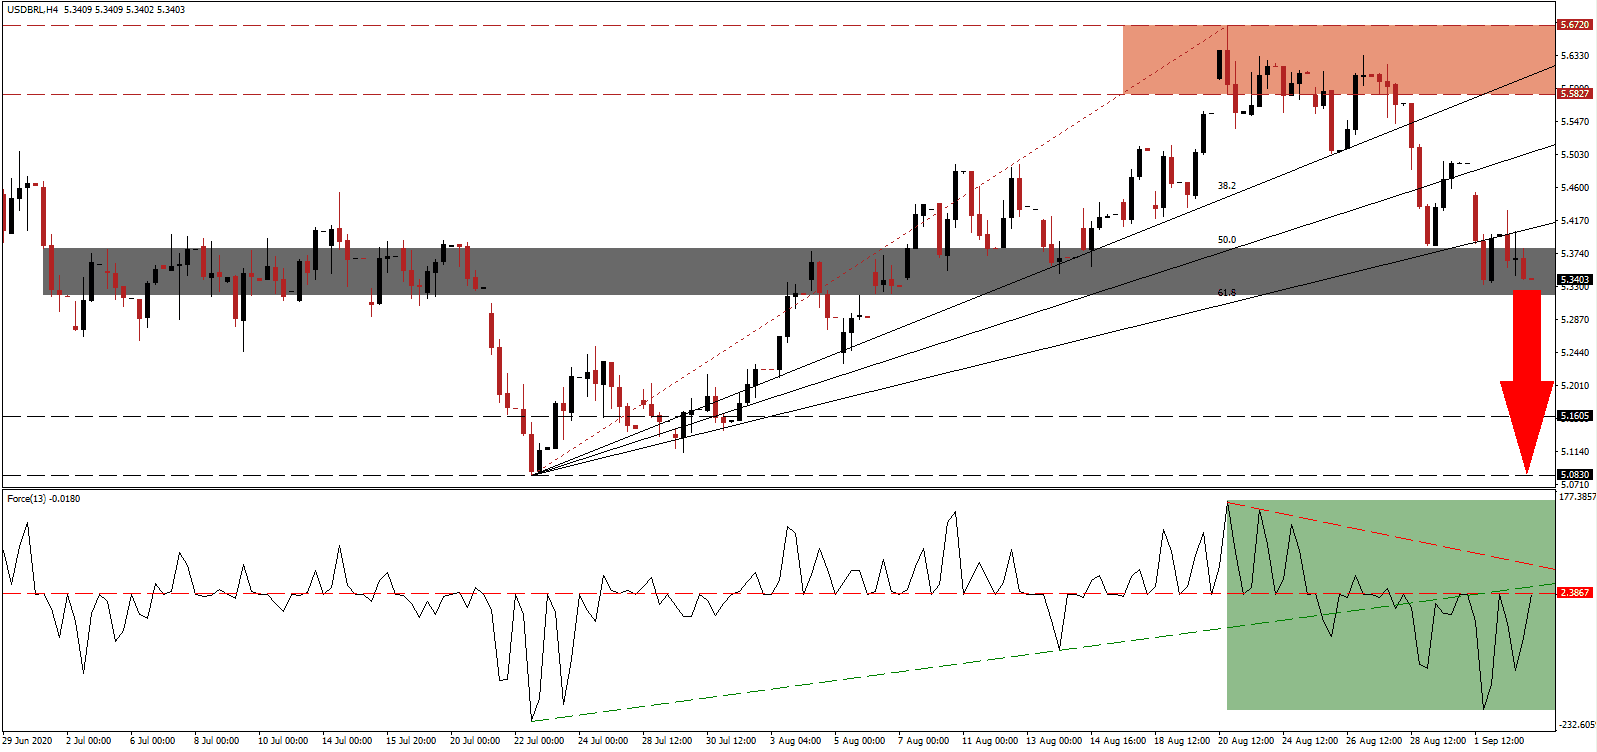
The Force Index, a next-generation technical indicator, reversed from a multi-week low and is now challenging its horizontal resistance level, as marked by the green rectangle. It remains below its ascending support level, with downside pressure kept intact by the descending resistance level. This technical is below the 0 center-line, and bears are in complete control over the USD/BRL.
Following the second-quarter slump, the size of the Brazilian economy is back to 2009, and 15% below its 2014 peak. Predictions call for a slow recovery, with 2023 noted as the return to pre-Covid-19 level. The only bright spot was agriculture, up 0.4%, while the industrial sector plunged 12.3%. Services contracted by 9.7%, fixed investment dropped 15.4%, and private, as well as government spending retreated by 12.5% and 8.8%, respectively. After the breakdown in the USD/BRL below its resistance zone located between 5.5827 and 5.6720, as identified by the red rectangle, the bearish chart pattern was confirmed.
One bright spot leading economic recovery is the manufacturing sector, with the August PMI surging to 64.7, following July’s upward surprise reading of 58.2. Paulo Guedes, the Minister of the Economy, acknowledged the significant contraction but did claim the economy is amid a V-shaped recovery. The breakdown in the USD/BRL below its ascending 61.8 Fibonacci Retracement Fan Support Level took price action into its short-term support zone located between 5.3192 and 5.3809, as marked by the grey rectangle. A breakdown into its next support zone between 5.0803 and 5.1605 is favored to extend the correction.
USD/BRL Technical Trading Set-Up - Breakdown Scenario
Short Entry @ 5.3400
Take Profit @ 5.0900
Stop Loss @ 5.4200
Downside Potential: 2,500 pips
Upside Risk: 800 pips
Risk/Reward Ratio: 3.13
Should the Force Index push through its descending resistance level, the USD/BRL could attempt to reverse. The US labor market remains significantly weaker than anticipated, with economic sub-components confirming job losses. Yesterday’s ADP data clocked in at less than half the predicted figure. Forex traders should sell any price spike from present levels, with the upside potential limited to its 38.2 Fibonacci Retracement Fan Resistance Level.
USD/BRL Technical Trading Set-Up - Limited Reversal Scenario
Long Entry @ 5.5000
Take Profit @ 5.6300
Stop Loss @ 5.4200
Upside Potential: 1,300 pips
Downside Risk: 800 pips
Risk/Reward Ratio: 1.63

