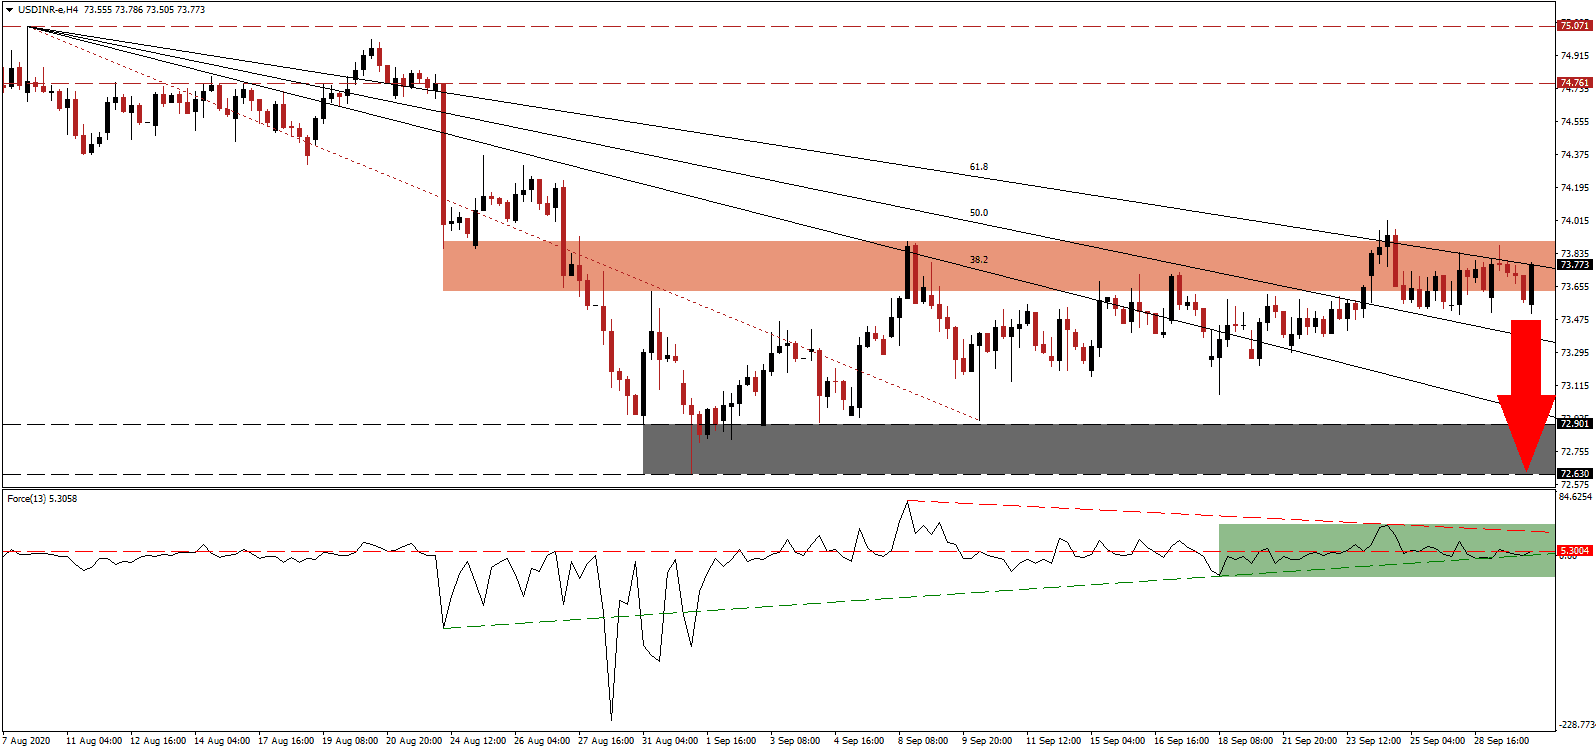
India continues to report the highest number of daily new Covid-19 infections, but one must consider the size of its population, the second-largest behind China. A superior view of the pandemic provides the data per 1,000,000 citizens, where India has 4,499 cases. By comparison, the US, Brazil, Russia, and Columbia, the other four countries in the Top 5, have 22,342, 22,450, 8,001, and 16,153 cases, respectively. Therefore, the most recent economic downgrades appear too excessive, with some calling for the fiscal year 2021 to show a double-digit GDP collapse. The USD/INR presently challenges its short-term resistance zone, which rejected it three times, with a fourth one expected.
The Force Index, a next-generation technical indicator, points towards the lack of bullish momentum. While the ascending support level pressures it for a move above its horizontal resistance level, as marked by the green rectangle, the descending resistance level exercises more prominent downside pressure. Bears wait for this technical indicator to retreat below the 0 center-line to regain full control over the USD/INR.
High-frequency indicators suggest a gradual increase in economic activity across India. Government cash-transfers to the bottom 33% of the population, particularly in rural areas, boosted the dominant agricultural sector. The outlook remains uncertain, mirroring other economies, and the uptick in manufacturing is credited to inventory restocking before the second wave of infections, already materializing across Europe, gathers pace. With the USD/INR challenging its short-term resistance zone located between 73.625 and 73.899, as marked by the red rectangle, breakdown pressures accumulate.
While exports posted a 12.7% drop in August year-over-year, agricultural and pharmaceuticals posted an increase of 22.0% and 17.0%, respectively. Consumers remain cautious, with credit demand at 5.5% in August compares to 12.0% one year ago. The Indian economy shows signs of stability with gradual recovery prospects, despite a surge in Covid-19 infections. Price action faces downside pressure from its descending 61.8% Fibonacci Retracement Fan Resistance Level. The USD/INR is positioned to correct back into its support zone located between 72.630 and 72.901, as identified by the grey rectangle.
USD/INR Technical Trading Set-Up - Breakdown Scenario
Short Entry @ 73.770
Take Profit @ 72.630
Stop Loss @ 74.020
Downside Potential: 11,400 pips
Upside Risk: 2,500 pips
Risk/Reward Ratio: 4.56
A breakout in the Force Index above its descending resistance level may lead the USD/INR temporarily higher. Forex traders should take advantage of any advance with new short positions amid a worsening economic outlook for the US, magnified by political uncertainty. The upside potential remains confined to its intra-day high of 74.370, which initiated a previous sell-off in price action.
USD/INR Technical Trading Set-Up - Confined Breakout Scenario
Long Entry @ 74.150
Take Profit @ 74.320
Stop Loss @ 74.020
Upside Potential: 1,700 pips
Downside Risk: 1,300 pips
Risk/Reward Ratio: 1.31

