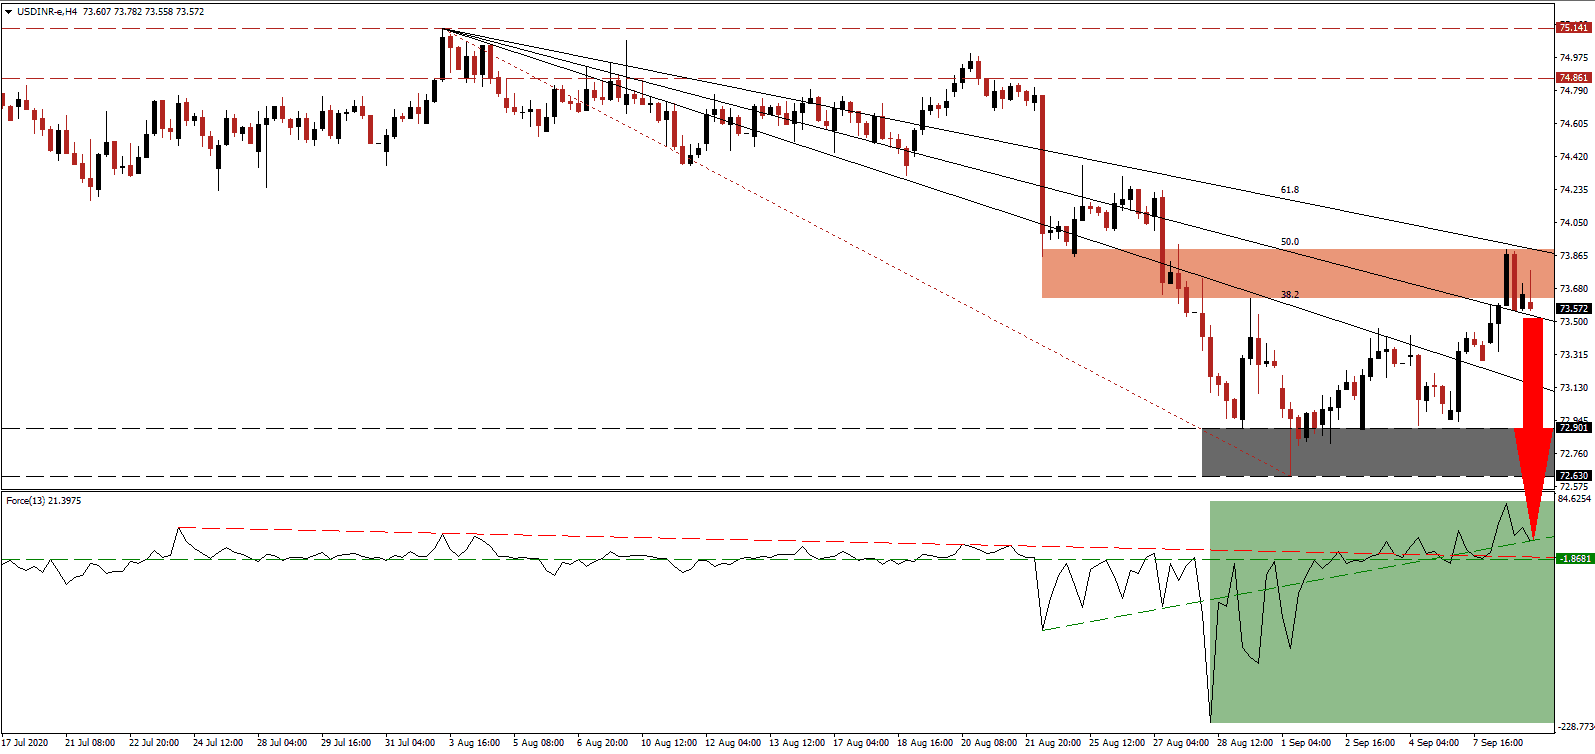
It is also home to the third-highest death count, and the virus appears to spread out of control, surpassing over 90,000 new daily cases and more than 1,000 deaths. Among major global economies, India is the most affected one, and high-frequency indicators have either plateaued or are already declining. The combination sufficed to push the USD/INR into its enforced short-term resistance zone, from where a profit-taking sell-off may materialize.
The Force Index, a next-generation technical indicator, confirmed the counter-trend advance with a significant reversal from a new multi-month low. After recording a recent multi-week peak, it challenges its ascending support level, suggesting fading bullish momentum. With the descending resistance level on the verge of crossing below its horizontal support level, as marked by the green rectangle, an accelerated correction in this technical indicator is favored. A move below the 0 center-line will grant bears the upper hand in the USD/INR.
With the Covid-19 pandemic out-of-control, joining the US, GDP forecasts have been lowered swiftly for the fiscal year ending March 2021. Fitch Ratings slashed its forecast from a decrease of 5.0% to a drop of 10.5%. Goldman Sachs predicts a contraction of 14.8% after the quarter ending in June witnessed a collapse of 23.9%. Despite the depressing outlook, intensifying US Dollar weakness remains dominant, keeping the bearish chart pattern intact. The USD/INR faces rejection by its short-term resistance zone located between 73.625 and 73.899, as identified by the red rectangle.
Global economic reports indicate the post-lockdown recovery is losing steam, and many countries are ill-prepared for a second infection wave of Covid-19 in combination with seasonal influenza. Concerns over the safety of rushed vaccines, evident by AstraZeneca’s end of testing for its candidate related to it, cannot be ignored. The descending 61.8 Fibonacci Retracement Fan Resistance Level enforces the bearish chart pattern, and the USD/INR is well-positioned to correct into its support zone located between 72.630 and 72.901, as marked by the grey rectangle. A breakdown can extend the sell-off into its next support zone between 71.419 and 71.710.
USD/INR Technical Trading Set-Up - Profit-Taking Scenario
- Short Entry @ 73.570
- Take Profit @ 71.570
- Stop Loss @ 74.090
- Downside Potential: 20,000 pips
- Upside Risk: 5,200 pips
- Risk/Reward Ratio: 3.85
Should the Force Index bounce off of its descending resistance level, serving as temporary support, the USD/INR may attempt a short-term breakout. Any advance from present levels will allow Forex traders a secondary selling opportunity, magnified by US Dollar weakness. A decrease in consumer spending and a double-dip recession cannot be excluded. The upside potential is limited to its long-term resistance zone between 74.861 and 75.141.
USD/INR Technical Trading Set-Up - Limited Breakout Scenario
- Long Entry @ 74.390
- Take Profit @ 74.890
- Stop Loss @ 74.090
- Upside Potential: 5,000 pips
- Downside Risk: 3,000 pips
- Risk/Reward Ratio: 1.67

