With daily Covid-19 infections across India at alarming levels and total cases are on course to surpass 5,000,000 in the next 24 hours, GDP forecasts for the fiscal year 2021, ending March 2021. Japanese brokerage Nomura offers the most optimistic assessment at a contraction of 10.8%. Rating agency Moody's Investors Service calls for a drop of 11.5%, and US bank Goldman Sachs predicts a 14.8% plunge. Despite the downward revisions, following the 23.9% collapse in the April through June quarter, the USD/INR remains in a bearish chart pattern, expected to lead to a new breakdown sequence.
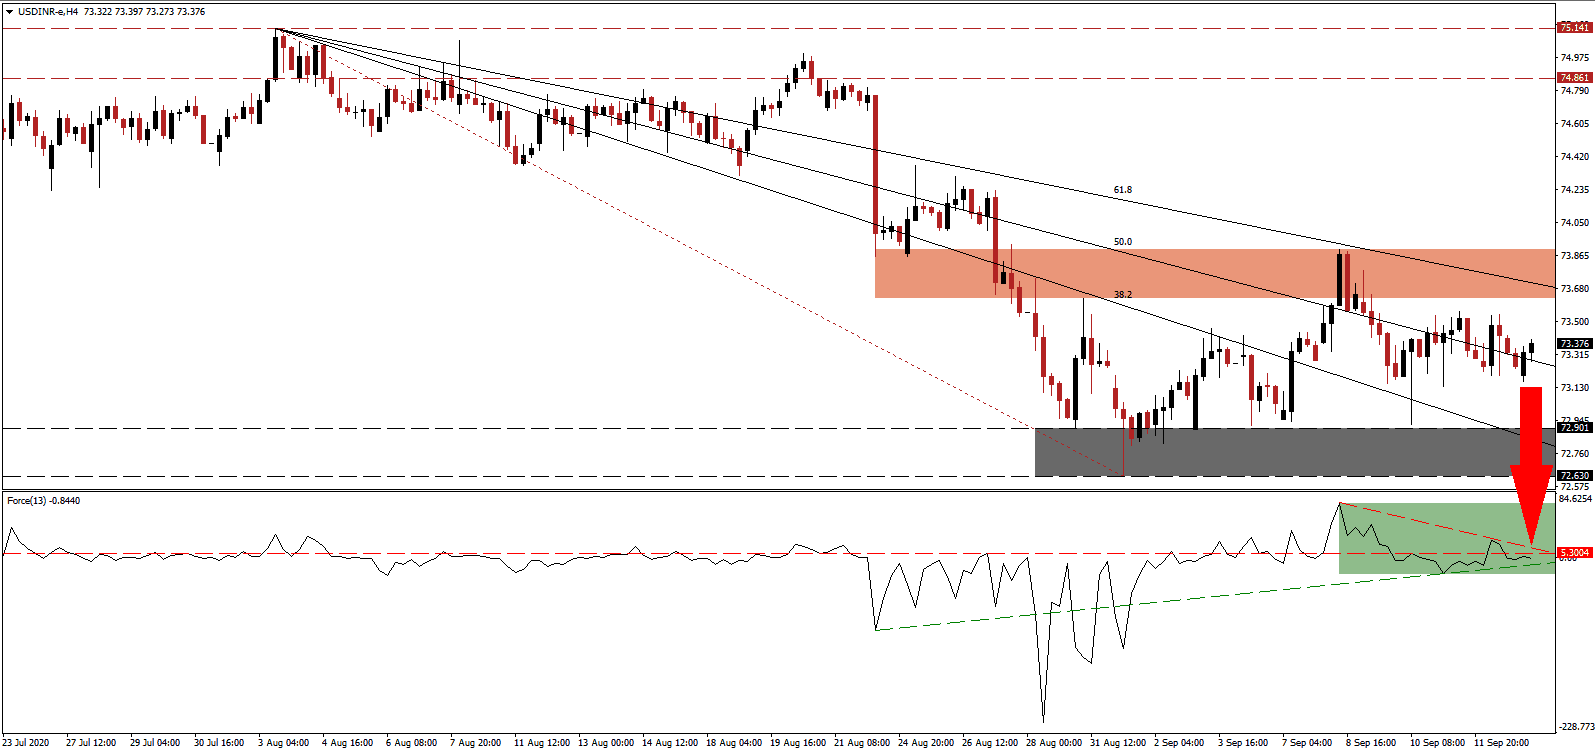
The Force Index, a next-generation technical indicator, was rejected by its descending resistance level and moved back below its horizontal resistance level, as marked by the green rectangle. Dominant bearish progress is favored to extend the slide below its ascending support level, deeper into negative territory. Bears will then regains complete control over the USD/INR.
Following border tensions between India and China, which left several troops dead on both sides in June, the Indian Minister of External Affairs Subrahmanyam Jaishankar met with State Councilor of the People's Republic of China and Minister of Foreign Affairs Wang Yi in Russia. Both sides agreed to a five-point plan to de-escalate tensions across the Line of Actual Control (LAC), dividing the world's two most populous nations. After the USD/INR completed a breakdown below its short-term resistance zone located between 73.625 and 73.899, as marked by the red rectangle, bearish progress intensified.
India may experience a minor domestic manufacturing revolution, but the domestic economy will take time to heal. Confirming the stress is the latest Economic Freedom of the World report published by the Canadian Fraser Institute. India dropped 26 places from 79 to 105, out of 162 surveyed countries. Despite short-to-medium-term challenges, the long-term outlook is increasingly bullish. A breakdown in the USD/INR below its descending 50.0 Fibonacci Retracement Fan Support Level will clear the path into its support zone located between 72.630 and 72.901, as identified by the grey rectangle. An extension into its next support zone between 71.419 and 71.710 remains a distinct probability.
USD/INR Technical Trading Set-Up - Profit-Taking Scenario
Short Entry @ 73.375
Take Profit @ 71.420
Stop Loss @ 73.755
Downside Potential: 19,550 pips
Upside Risk: 3,800 pips
Risk/Reward Ratio: 5.15
In case the Force Index pushes through its descending resistance level, the USD/INR could seek more upside temporarily. Forex traders should consider any price spike as a secondary selling opportunity amid ongoing weakness in the US Dollar. The likelihood of more debt in conjunction with a second Covid-19 infection wave and depressed economic activity adds to breakdown catalysts. The upside potential remains confined to its intra-day high of 74.370.
USD/INR Technical Trading Set-Up - Confined Breakout Extension Scenario
Long Entry @ 73.955
Take Profit @ 74.350
Stop Loss @ 73.755
Upside Potential: 3,950 pips
Downside Risk: 2,000 pips
Risk/Reward Ratio: 1.98

