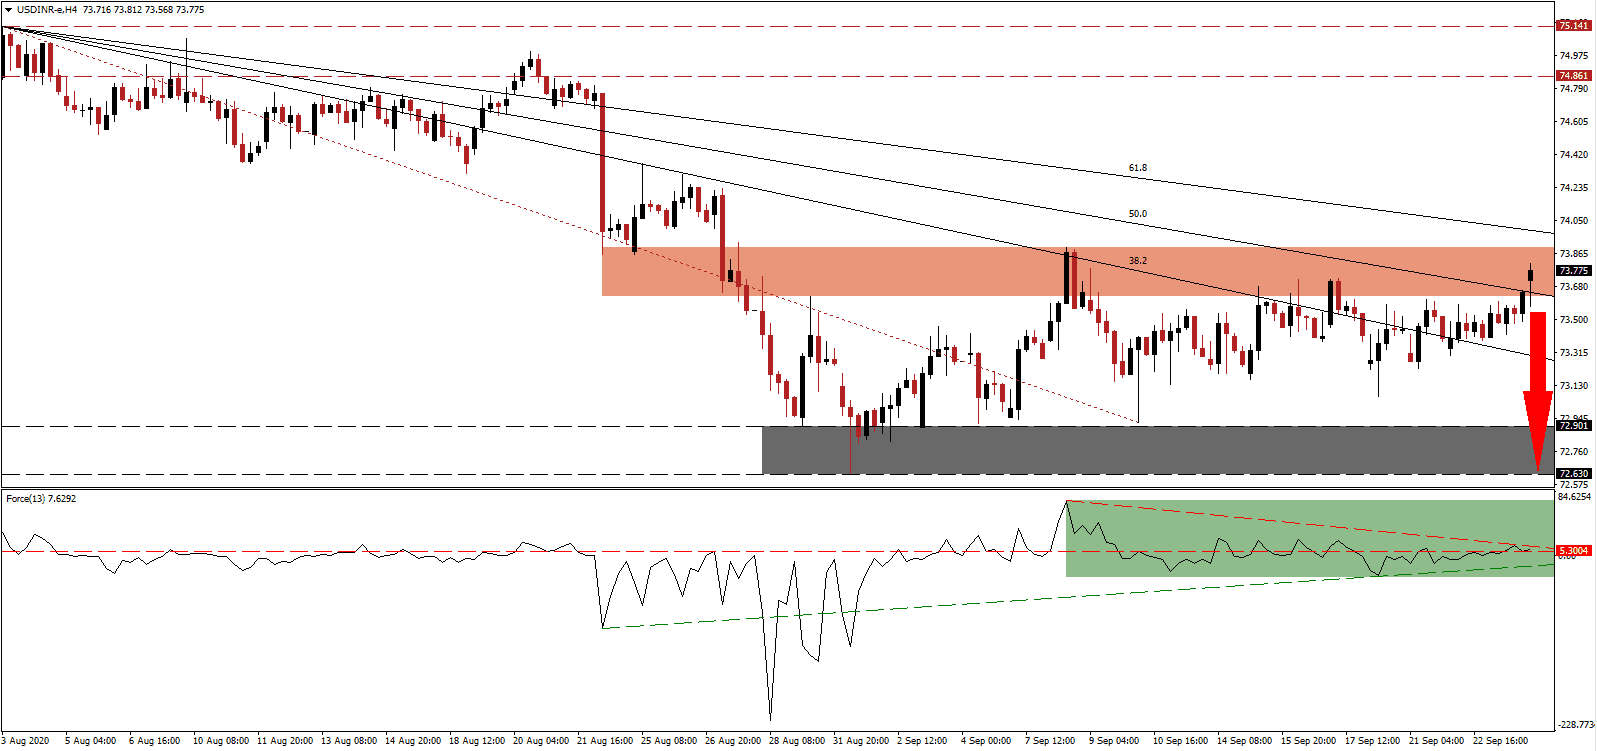
India is on course to overtake the US as the most-infected Covid-19 country globally, as it reports over 80,000 infections daily, and expected top breach 6,000,000 confirmed cases by this weekend. While behind the US, at over 7,100,000, the current trajectory will push India to the top spot in October. Per the UN Conference on Trade and Development (UNCTAD) Trade and Development Report 2020, India will face a GDP drop of 5.9% versus a global forecast for a decline of 4.3%. The USD/INR spiked into its short-term resistance zone, but the lack of bullish momentum suggests a profit-taking sell-off is likely.
The Force Index, a next-generation technical indicator, briefly advanced above its horizontal resistance level before retracing below it, as marked by the green rectangle. It resulted in an adjustment of the descending resistance level while rising bearish pressures are set to guide it below its ascending support level. Bears wait for this technical indicator to correct below the 0 center-line to resume complete control over the USD/INR.
With the spike in new Covid-19 infections, localized lockdown measures return, adding more downward pressures for global trade. The UNCTAD expects a 40% loss in foreign direct investment flows and a $100 billion decrease in remittances, essential to many economies. It will result in the adjustment of supply chains and the recalibration of economies towards domestic strength, which can benefit India in the long-term. After the USD/INR advanced into its short-term resistance zone located between 73.625 and 73.899, as marked by the red rectangle, breakdown pressures have magnified.
While the Indian economy is poised to recover in 2021, in line with global output but below the GDP loss-rate of 2020, fears of a permanent income loss remain. UNCTAD expects global economic output to decrease by $6 trillion globally and cautioned against high-debt levels ushering in a lost decade. Prime Minister Narendra Modi refused to give in to pressures and avoided adding excessive debt for short-term economic relief. A correction in the USD/INR below its descending 50.0 Fibonacci Retracement Fan Support Level will clear the path into its support zone located between 72.630 and 72.901, as identified by the grey rectangle.
USD/INR Technical Trading Set-Up - Profit-Taking Scenario
- Short Entry @ 73.770
- Take Profit @ 72.630
- Stop Loss @ 74.020
- Downside Potential: 11,400 pips
- Upside Risk: 2,500 pips
- Risk/Reward Ratio: 4.56
A sustained breakout in the Force Index above its descending resistance level can take the USD/INR temporarily higher. Forex traders should consider any advance as a selling opportunity due to a bearish outlook for the US Dollar. Unsustainable debt level, a weak labor market, and political uncertainty add to long-term selling pressure. The upside potential is confined to its intra-day high of 74.370, from where the latest sell-off emerged.
USD/INR Technical Trading Set-Up - Confined Breakout Scenario
- Long Entry @ 74.150
- Take Profit @ 74.350
- Stop Loss @ 74.020
- Upside Potential: 2,000 pips
- Downside Risk: 1,300 pips
- Risk/Reward Ratio: 1.54

