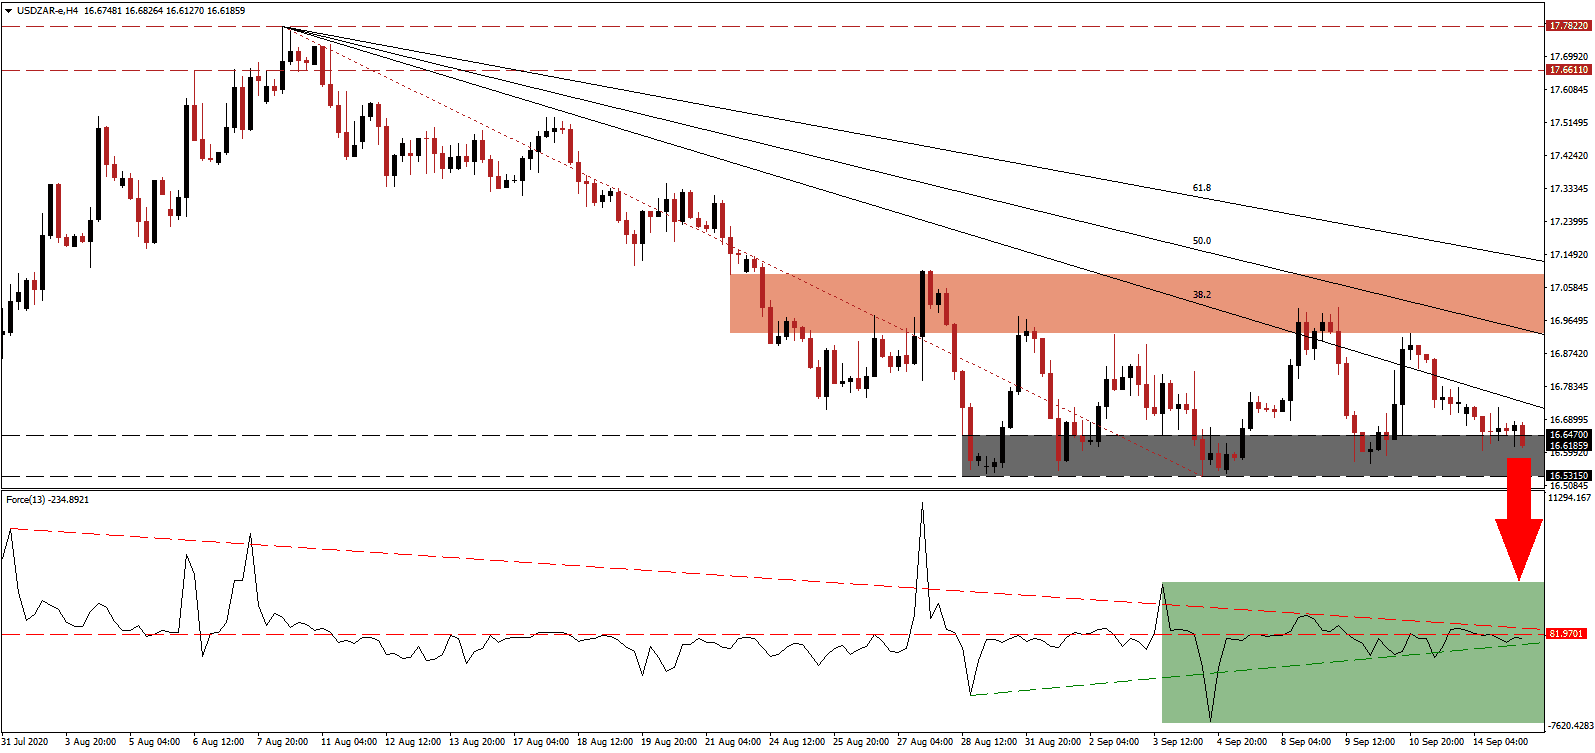
After South Africa reported a 51.0% quarterly and 17.1% annualized GDP collapse in the second quarter, Finance Minister Tito Mboweni confirmed the 2020 full-year contraction would be worse than the present South African Reserve Bank (SARB) forecast for a decrease of 7.3%. The National Treasury predicts a 7.0% contraction, but both face revisions after the dismal second-quarter data. Following the rejection in the USD/ZAR by its short-term resistance zone, dominant bearish pressures are set to force a new breakdown.
The Force Index, a next-generation technical indicator, confirms rising bearish momentum below its horizontal resistance level. Adding to breakdown pressures is the descending resistance level, as marked by the green rectangle, favored to guide the Force Index below its ascending support level. Bears remain in control over the USD/ZAR with this technical indicator below the 0 center-line.
Adding to bullish economic developments for South African is the banking sector, which will weather the crisis despite a drop in revenues and a surge in defaults. It will support the post-Covid-19 economic recovery, expected to be slow and lengthy. Fikile Mbalula, the Minister of Transport, confirmed that international travel would resume shortly, with the National Coronavirus Command Council discussing details. The USD/ZAR created a lower high at the bottom range of its short-term resistance zone located between 16.9296 and 17.0924, as marked by the red rectangle, confirming the bearish chart pattern.
One central issue remains economic reforms and structural changes in the vast number of capital draining state-owned enterprises (SOEs). Eskom, the utility responsible for nearly 90% of output, struggled for years under ownership by the Department of Public Enterprises (DPE), limiting economic potential. Finance Minister Mboweni referenced accelerated reforms under project Operation Vulindlela without providing details. The descending Fibonacci Retracement Fan Resistance sequence is favored to force the USD/ZAR into a breakdown below its support zone located between 16.5315 and 16.6470, as identified by the grey rectangle. The next support zone awaits between 15.7482 and 15.9963.
USD/ZAR Technical Trading Set-Up - Breakdown Scenario
Short Entry @ 16.6200
Take Profit @ 15.7500
Stop Loss @ 16.8300
Downside Potential: 8,700 pips
Upside Risk: 2,100 pips
Risk/Reward Ratio: 4.14
A breakout in the Force Index above its descending resistance level may lead the USD/ZAR into another reversal attempt. With the US labor market showing signs of weakness, a drop in consumer spending with a second Covid-19 infection wave increase the risk of a double-dip recession. Forex traders should consider any advance as a selling opportunity with the upside potential limited to its 61.8 Fibonacci Retracement Fan Resistance Level.
USD/ZAR Technical Trading Set-Up - Limited Reversal Scenario
Long Entry @ 16.9300
Take Profit @ 17.1100
Stop Loss @ 16.8300
Upside Potential: 1,800 pips
Downside Risk: 1,000 pips
Risk/Reward Ratio: 1.80

