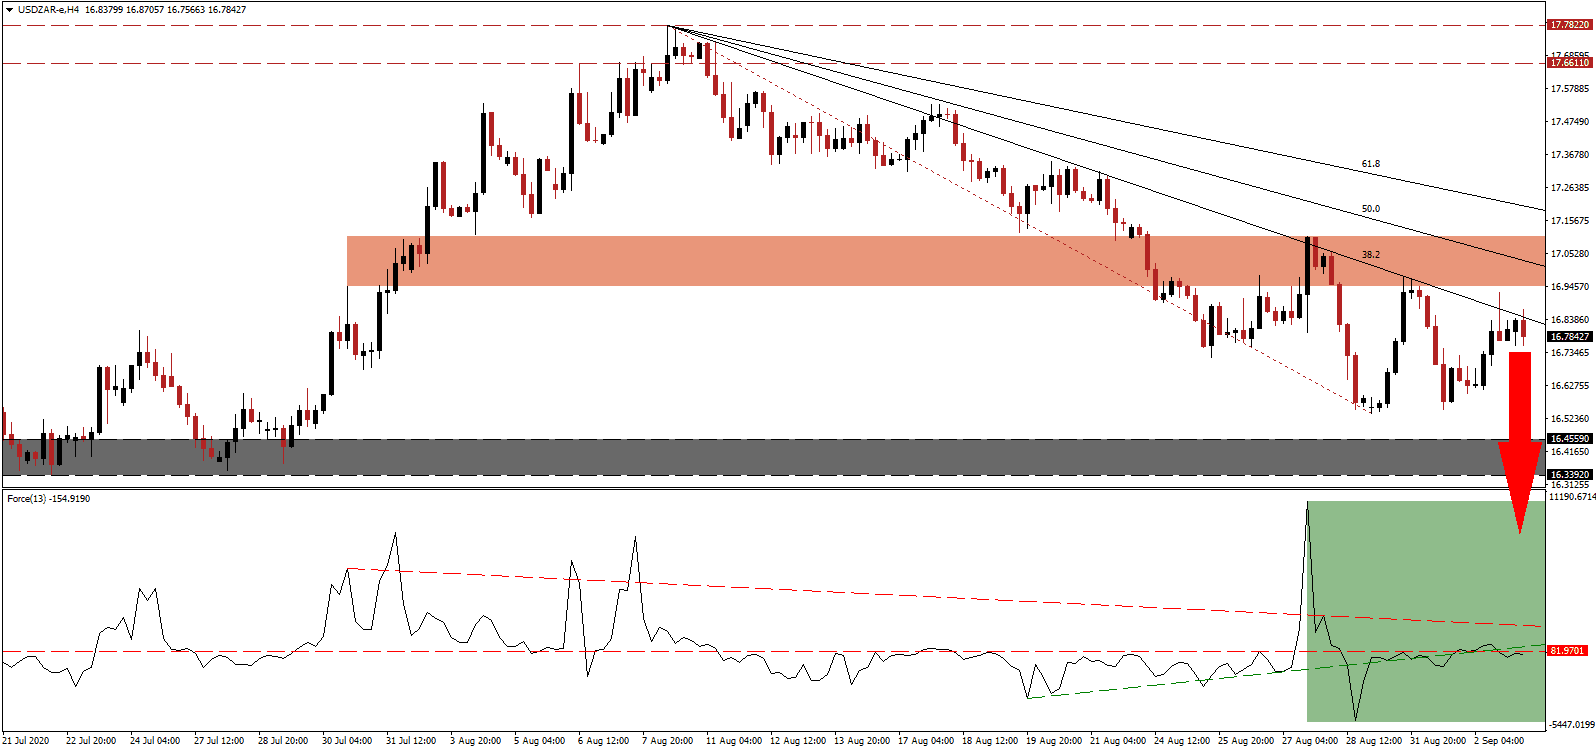
South Africa battles numerous crises at once, even before the Covid-19 pandemic added distinct negative pressures on Africa’s most industrialized nation and second-largest economy measured by GDP, trailing only Nigeria. With more than 2,000 daily infections serving as a reminder of the presence of Covid-19, electricity outages related to issues at Eskom continue to harm recovery prospects. Over 100 German engineers assist with upgrading the network and German-owned factories. The USD/ZAR continues to accumulate downside pressures following the double rejection by its short-term resistance zone.
The Force Index, a next-generation technical indicator, confirms the dominance of bearish momentum after it corrected below its ascending support level and its horizontal resistance level. Increasing downside pressures is the descending resistance level, as marked by the green rectangle. Bears remain in full control over the USD/ZAR with this technical indicator below the 0 center-line.
After President Ramaphosa survived a bid to out him over the weekend, enthusiasm over his pledge to fight corruption is fading. The attention remains focused on the pandemic and an unemployment rate above 31%. Economists lowered their initial 2020 GDP forecast from a growth rate of 0.6% to a contraction of 8.1%. The 2021 outlook increased from an expansion of 1.2% to 3.2%. After the second rejection by its short-term resistance zone located between 16.9456 and 17.1058, as marked by the red rectangle, the USD/ZAR is well-positioned to accelerate its breakdown sequence.
Finance Minister Tito Mboweni advised public institutions to implement zero-based budgeting amid strained public finances. The Treasury cautioned against the present course of debt, with the debt-to-GDP ratio expected to reach 82% by the end of the year. It added that a financial crisis would cost the country R2 trillion in lost economic activity. The descending 38.2 Fibonacci Retracement Fan is favored to pressure the USD/ZAR into its support zone located between 16.3392 and 16.4559, as identified by the grey rectangle. A breakdown into its next support zone between 15.7482 and 15.9963 is probable.
USD/ZAR Technical Trading Set-Up - Breakdown Extension Scenario
Short Entry @ 16.7800
Take Profit @ 15.7800
Stop Loss @ 17.1100
Downside Potential: 10,000 pips
Upside Risk: 3,300 pips
Risk/Reward Ratio: 3.03
A breakout in the Force Index above its descending resistance level may temporarily lead to a price spike. While US manufacturing data surprised to the upside, the employment sub-component confirmed job losses. ADP data for August confirmed the dire state of the labor market. Forex traders should sell any rallies from present levels, with the upside potential confined to its intra-day high of 17.5286.
USD/ZAR Technical Trading Set-Up - Confined Breakout Scenario
Long Entry @ 17.2600
Take Profit @ 17.5100
Stop Loss @ 17.1100
Upside Potential: 2,500 pips
Downside Risk: 1,500 pips
Risk/Reward Ratio: 1.67

