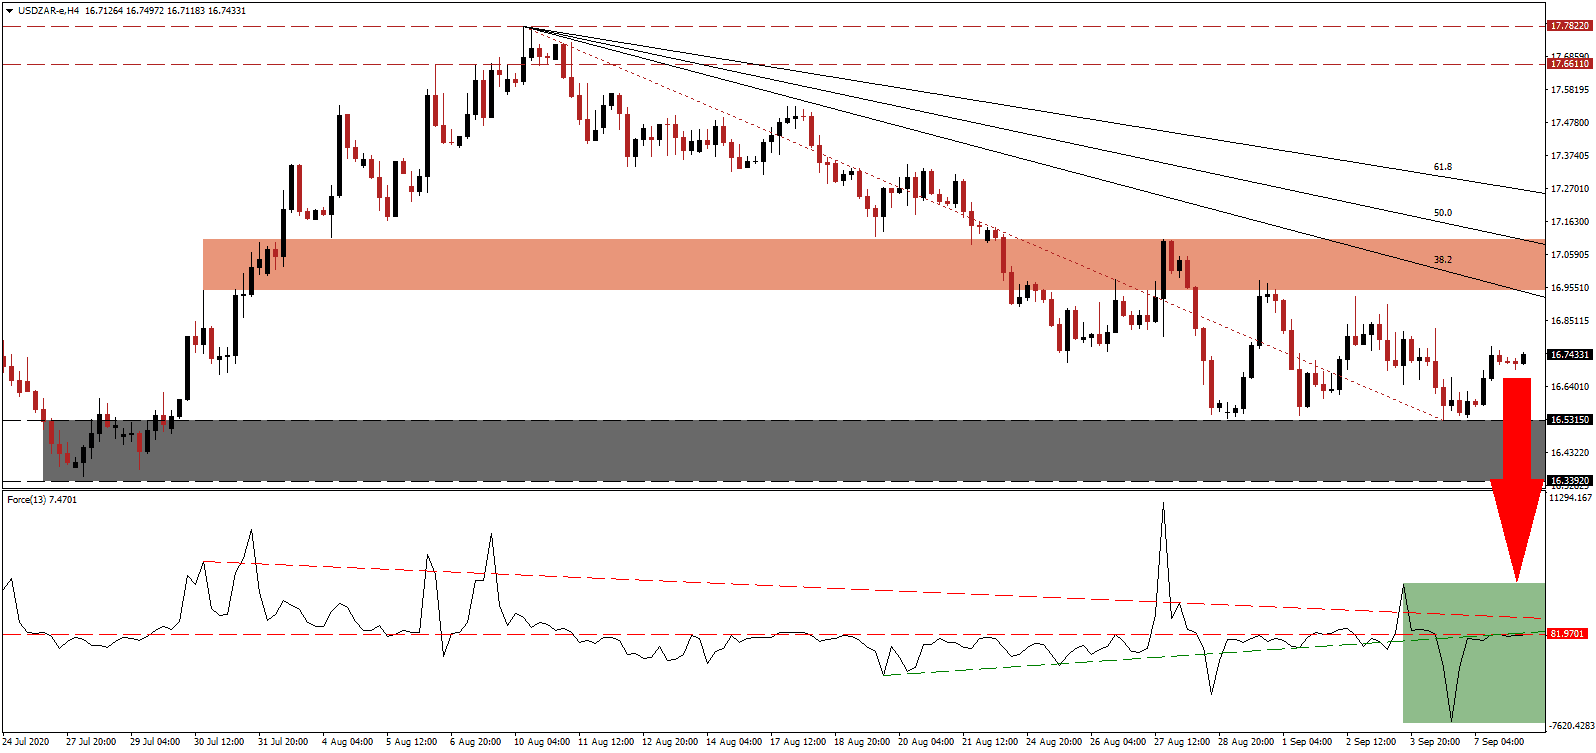
South Africa likely faced a massive collapse in its second-quarter GDP, with estimates ranging between 20% and 53%. Later today, Statistics South Africa (Stats SA), the national statistical service of South Africa, will release official data, with a median forecast for a plunge of 47.3% quarter-over-quarter, and 16.5% year-over-year. A small silver lining may be the third-quarter recovery, where a Reuters poll suggests an 18.6% expansion, but a double dig recession globally remains a risk to consider. The USD/ZAR bounced off of its support zone, but the lack of bullish momentum is favored to extend the correction.
The Force Index, a next-generation technical indicator, reversed its plunge to a new multi-month low. It does maintain its position below its ascending support level and its horizontal resistance level. Adding to downside pressures is the descending resistance level, as marked by the green rectangle. Bears wait for this technical indicator to slide below the 0 center-line to regain complete control over the USD/ZAR.
Before the Covid-19 pandemic forced a nationwide lockdown, the economy performed below capacity due to issues at utility Eskom. Frequent blackouts resulted in load shedding to prevent more damage to the fragile electricity infrastructure. South Africa invited over 100 engineers to upgrade German-owned factories and assist with improvements at Eskom. The success will play a significant part in the economic future of South Africa. While the USD/ZAR may spike into its short-term resistance zone located between 16.9456 and 17.1058, as identified by the red rectangle, the long-term outlook remains bearish, and the descending Fibonacci Retracement Fan sequence expected to enforce it.
Adding to bearish progress is continued weakness in the US Dollar, anticipated to intensify as the US Federal Reserve essentially pledged to keep interest rates depressed for years to come. The unsustainable debt pile adds to downside momentum, with annual interest payments to service existing debt over $1 trillion, while the government considers adding more to it. The USD/ZAR is well-positioned to correct into its support zone located between 16.3392 and 16.5315, as marked by the grey rectangle. A breakdown into its next support zone between 15.7482 and 15.9963 is probable.
USD/ZAR Technical Trading Set-Up - Breakdown Resumption Scenario
Short Entry @ 16.7450
Take Profit @ 15.7550
Stop Loss @ 16.9550
Downside Potential: 9,900 pips
Upside Risk: 2,100 pips
Risk/Reward Ratio: 4.71
A sustained breakout in the Force Index above its descending resistance level can lead the USD/ZAR farther to the upside. Given the slowdown in the labor market recovery in the US, forecast to last years to reach pre-Covid-19 levels, and the reduction in support to the unemployed, consumer spending is forecast to suffer. The upside potential is confined to its 61.8 Fibonacci Retracement Fan Resistance Level, and Forex traders should sell any advance.
USD/ZAR Technical Trading Set-Up - Confined Reversal Extension Scenario
Long Entry @ 17.0550
Take Profit @ 17.2050
Stop Loss @ 16.9550
Upside Potential: 1,500 pips
Downside Risk: 1,000 pips
Risk/Reward Ratio: 1.50

