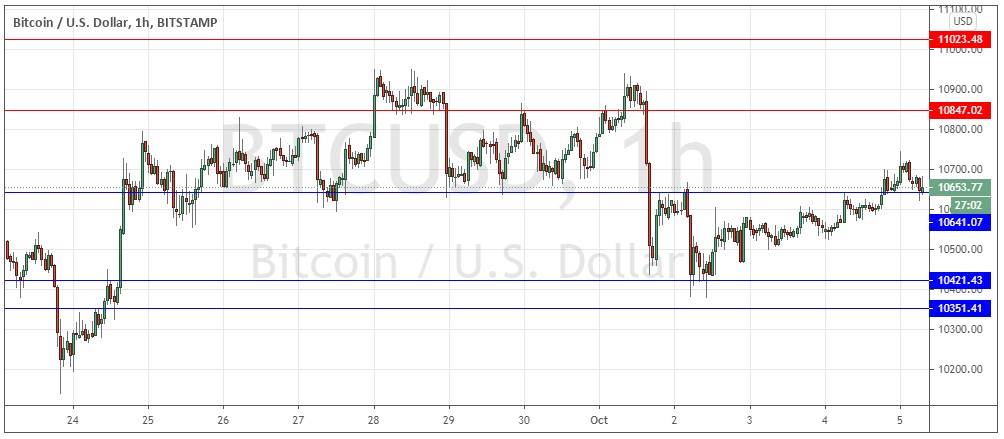
Last Thursday’s signals were not triggered, as the bullish price action at the support level of $10,421 printed too slowly to generate a long trade entry signal.
Today’s BTC/USD Signals
Risk 0.50% per trade.
Trades must be entered prior to 5 pm Tokyo time Tuesday.
Long Trade Ideas
- Go long after a bullish price action reversal on the H1 time frame following the next touch of $10,421 or $10,351.
- Put the stop loss $50 below the local swing low.
- Move the stop loss to break even once the trade is $50 in profit by price.
- Take off 50% of the position as profit when the trade is $50 in profit by price and leave the remainder of the position to run.
Short Trade Ideas
- Go short after a bearish price action reversal on the H1 time frame following the next touch of $10,847 or $11,023.
- Put the stop loss $50 above the local swing high.
- Move the stop loss to break even once the trade is $50 in profit by price.
- Take off 50% of the position as profit when the trade is $50 in profit by price and leave the remainder of the position to run.
The best method to identify a classic “price action reversal” is for an hourly candle to close, such as a pin bar, a doji, an outside or even just an engulfing candle with a higher close. You can exploit these levels or zones by watching the price action that occurs at the given levels.
BTC/USD Analysis
I wrote last Thursday that there was definitely more potential on the bullish side, but price advances continued to be slow.
I thought that the best approach to Bitcoin would be to still look for long-term buys at or close to the $10,000 level.
I thought it would be a significantly bullish development if the price can get established above the higher resistance level shown in the price chart below, at $11,023.
This was a good call as the price was bought after falling to an area not far from the key $10,000 area. The fact that the price has also remained below the resistance level I mentioned at $11,023 is also telling and has been a warning to bulls not to get overly excited.
We have seen the price grind higher after the low made early last Friday, but over the longer-term, it can be seen that the price is really just going sideways above $10,000. There is buying there, but no sign that the price is going to make any significant new highs above $11,023.
As long as this situation continues, I think buying at support levels just above $10,000 or even lower is likely to be the best approach. Selling at $11,023 could also be a good though shorter-term trade.
As long as the $10,000 area holds there is reason to expect an eventual price rise. The signal to get more bullish will come if and when the price can get established above $11,023.
Regarding the USD, there will be a release of ISM Non-Manufacturing PMI data at 3 pm London time.

