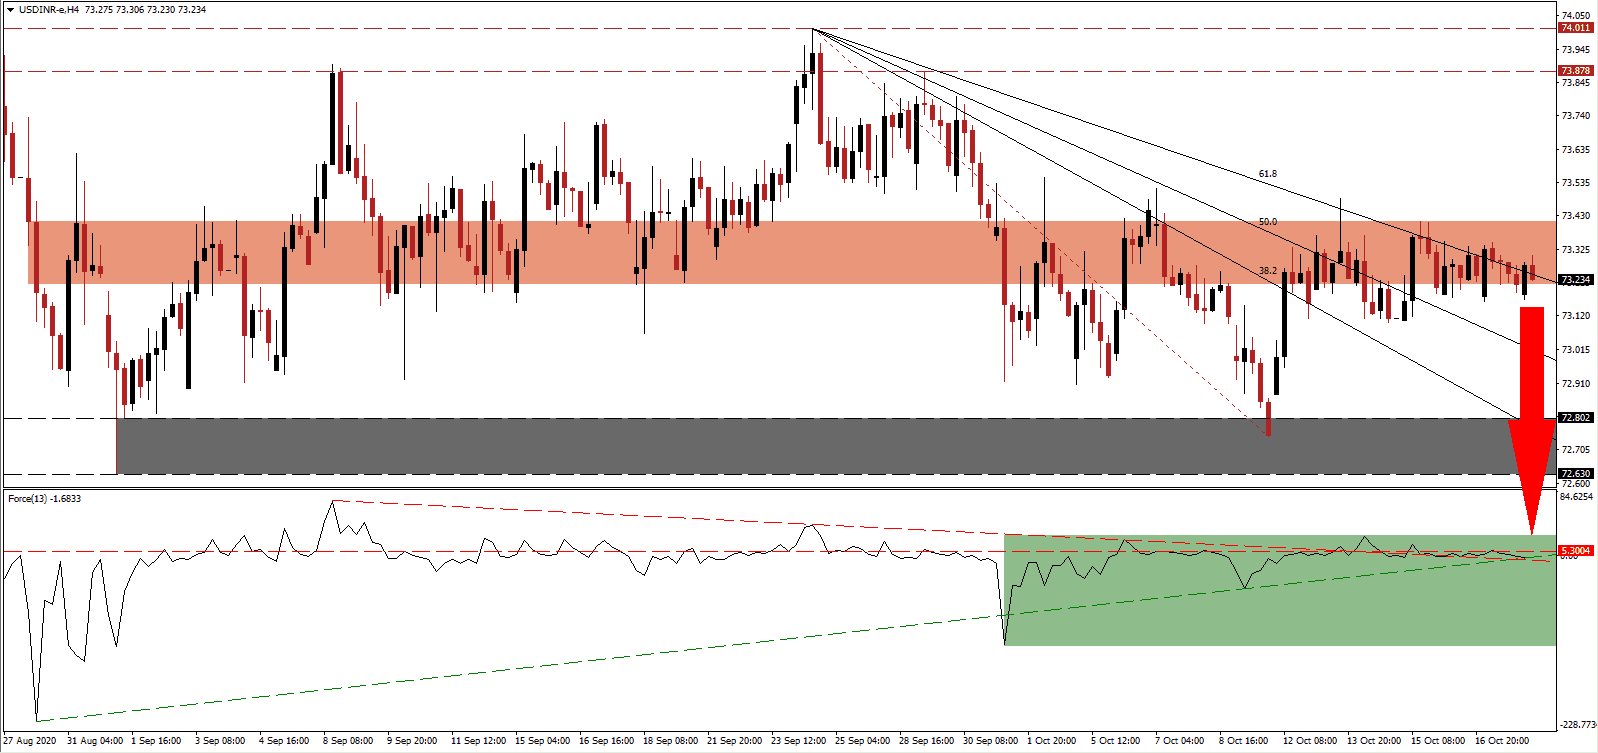
While the economy became one of the most severely impacted by the global pandemic, the chemical sector is now positioned to take a leadership position after becoming a net exporter following years of deficits. It employs over 2,000,000 Indian and accounts for 7% of GDP, and presents the latest evidence of ongoing and permanent economic adjustments forced by the virus. The USD/INR faces a new breakdown sequence following a sideways drift.
The Force Index, a next-generation technical indicator, created a series of lower highs and continues to slide after being rejected by its horizontal resistance level. It is on course to drop below its ascending support level, from where a breakdown below its descending resistance level is expected. Bears remain in control over the USD/INR with this technical indicator below the 0 center-line.
Prime Minister Narendra Modi plans to boost public finances by asking state-owned companies Coal India, NTPC, NMDC, MOIL, KIOCL, and Engineers India, plus two others, to repurchase shares from the government. The latest estimates suggest the government has more than ₹400 billion parked with eight of the largest SOEs. The USD/INR remains under downside pressure from its adjusted short-term resistance zone located between 73.218 and 73.412, as identified by the red rectangle, with bearish momentum expanding.
India also announced plans to allow its crude oil producers to re-export barrels from its strategic petroleum reserves (SPR). The investor-friendly policy decision aims to boost the return on investment and attract Middle Eastern oil producers, while the Indian government retains the first right of refusal. A sustained breakdown in the USD/INR below its descending 61.8 Fibonacci Retracement Fan Resistance Level will clear the path for an accelerated sell-off into its support zone located between 72.630 and 72.802, as marked by the grey rectangle. An extension into its next support zone between 71.419 and 71.710 is probable.
USD/INR Technical Trading Set-Up - Breakdown Scenario
Short Entry @ 73.230
Take Profit @ 71.430
Stop Loss @ 73.630
Downside Potential: 18,000 pips
Upside Risk: 4,000 pips
Risk/Reward Ratio: 4.50
In case the ascending support level can reverse the slide in the Force Index, the USD/INR may attempt a breakout. While India makes progress and takes advantage of opportunities to recalibrate its economy, the US remains committed to its debt-driven consumerism. Therefore, the long-term outlook is increasingly bearish, and Forex traders should sell any rallies. The upside potential is reduced to its downward adjusted resistance zone located between 73.878 and 74.011.
USD/INR Technical Trading Set-Up - Reduced Breakout Scenario
Long Entry @ 73.750
Take Profit @ 74.000
Stop Loss @ 73.630
Upside Potential: 2,500 pips
Downside Risk: 1,200 pips
Risk/Reward Ratio: 2.08

