India continues to suffer from inadequate Covid-19 testing capabilities, but the current capacity suffices to keep the world’s fifth-largest economy the second most-infected country behind the US. While criticism over Prime Minister Narendra Modi and his approach to the pandemic rise, so do isolated long-term positive developments. The International Monetary Fund (IMF) predicts an 8.8% economic recovery for 2021, short of the 10.3% GDP drop forecast for 2020, but enough for Mitsubishi Electric India to announce additional investments. The USD/INR challenges the bottom range of its short-term resistance zone favored to maintain the bearish chart pattern.
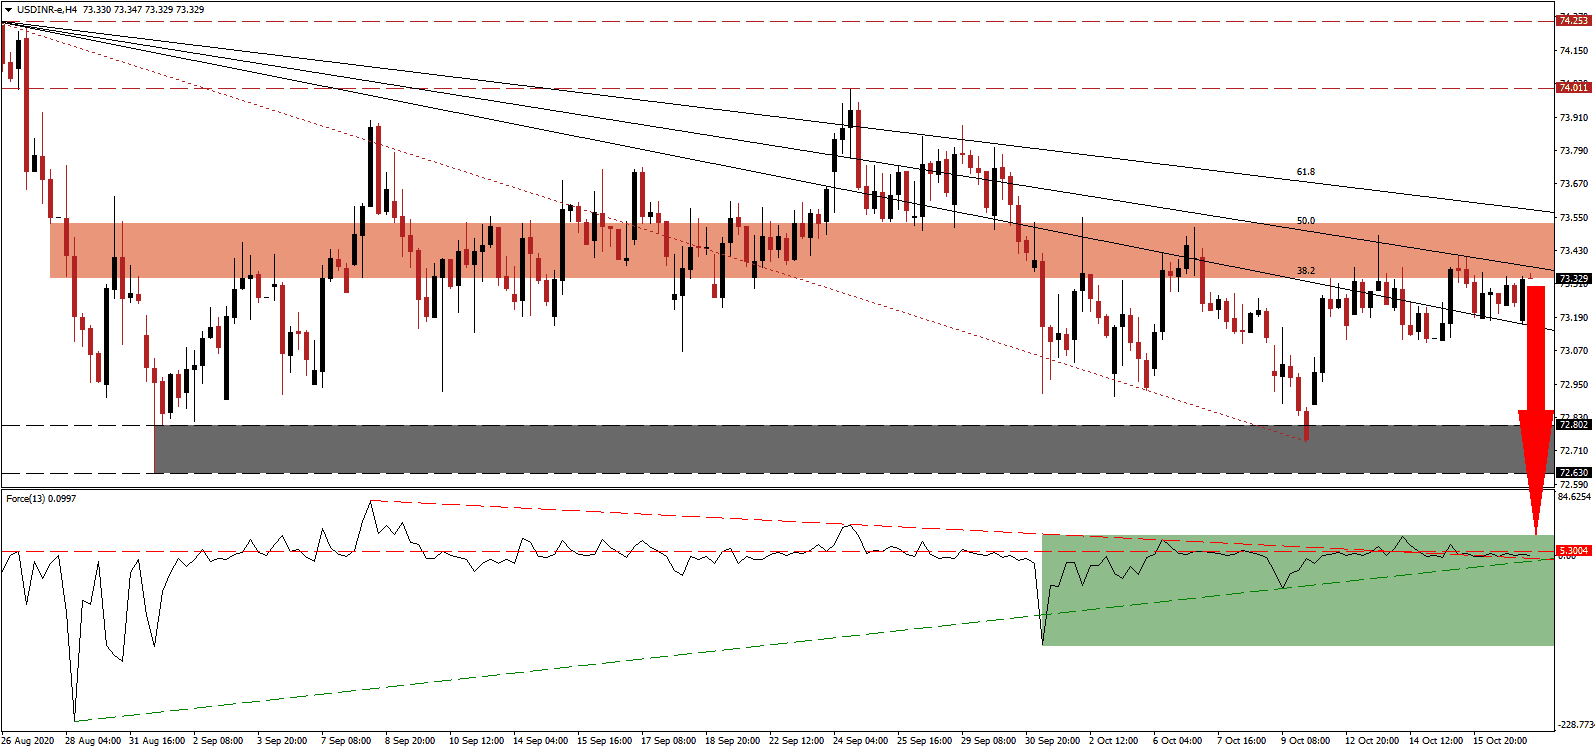
The Force Index, a next-generation technical indicator, remains below its horizontal resistance level. A pending crossover between its descending resistance level and its ascending support level, as marked by the green rectangle, suggest more downside potential. This technical indicator is well-positioned to collapse into negative territory, granting bears full control over the USD/INR.
With the Covid-19 pandemic intensifying globally, the export-oriented economy of India will have to maneuver through more challenges. Raghuram Rajan, a former Governor of the Reserve Bank of India (RBI), cautioned against the potential for a lost decade in India. He noted demonetization, difficulties with the Goods and Services Tax (GST), and the nationwide lockdown without monetary stimulus as the primary reasons for his warning. The USD/INR remains below its short-term resistance zone located between 73.331 and 73.528, as identified by the red rectangle, from where a new breakdown is likely.
Tension with China remains an unresolved non-Covid-19 related issue and adds to pressures for the government to halt eight quarters of slowing GDP growth. Bangladesh has overtaken India on a per capita GDP basis, which received widespread attention from the Indian public. With India at the crossroads, the majority of indications point towards a return to growth, and it remains the favored target for foreign investment. A breakdown in the USD/INR below its descending 38.2 Fibonacci Retracement Fan Support level can take it into its support zone located between 72.630 and 72.802, as marked by the grey rectangle. More downside into its next support zone between 71.419 and 71.710 is anticipated to materialize.
USD/INR Technical Trading Set-Up - Breakdown Scenario
Short Entry @ 73.330
Take Profit@ 71.430
Stop Loss @ 73.630
Downside Potential: 19,000 pips
Upside Risk: 3,000 pips
Risk/Reward Ratio: 6.33
Should the ascending support level pressure the Force Index higher, the USD/INR may follow suit. Forex traders should take advantage of any breakout attempt with new net short positions amid mounting bearishness in the US Dollar. Political uncertainty magnifies negative impacts from debt and a slowing economy. The upside potential remains limited to its downward revised long-term resistance zone between 74.011 and 74.253.
USD/INR Technical Trading Set-Up - Limited Breakout Scenario
Long Entry @ 73.750
Take Profit @ 74.000
Stop Loss @ 73.630
Upside Potential 2,500 pips
Downside Risk: 1,200 pips
Risk/Reward Ratio: 2.08

