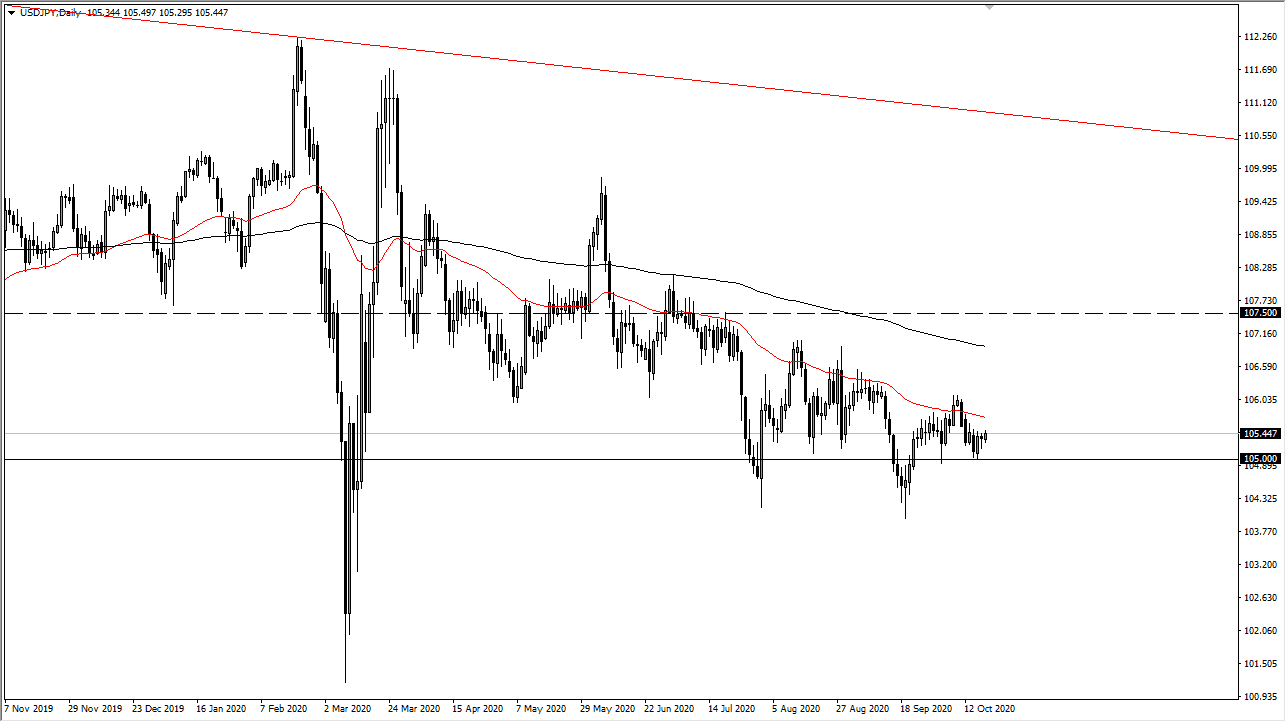
The US dollar rallied slightly during the trading session on Monday to kick off the week, as we have broken above the ¥105.50 level but gave back the short-term gains. Ultimately, this is a market that also has to deal with the 50 day EMA above, which is a technical indicator that a lot of people pay attention to. With this, I think that the market continues to be one that you fade short-term rallies that show signs of exhaustion, as we are more than likely going to go looking towards the ¥105 level underneath, which has been crucial more than once.
Looking at this chart, you can see that we have broken through the ¥105 level more than once, and therefore I think goes looking towards the ¥104 level. That is an area where we have bounced from a couple of times, so I think we will continue to reach towards. At this point, it is obvious that rallies continue to get sold into, so I think shorting some type of little bounce is probably likely to be the best way going forward. Ultimately, I think that we not only reach down towards the ¥104 level, but it is very likely that we extend down to the ¥102 level based upon previous precedence and the significant descending triangle that we are forming right now suggests that we are in fact going down to that area.
With bond yields in Japan yielding more than the United States, it makes sense that we would continue to see this market drop. Beyond that, if we in fact get stimulus eventually, that could have people selling the US dollar in general. The area between the 50 day EMA and the 200 day EMA is essentially like a “line of death” that buyer simply cannot get above there. I think that finding any signs of exhaustion above will continue to be a nice opportunity. Looking at this chart, we continue to make lower highs, but now the question is whether or not we can make a lower low? I see no reason why we cannot, but that does not necessarily mean that we get there right away. Looking at this chart, I see no reason whatsoever in trying to get long of this pair anytime soon.


