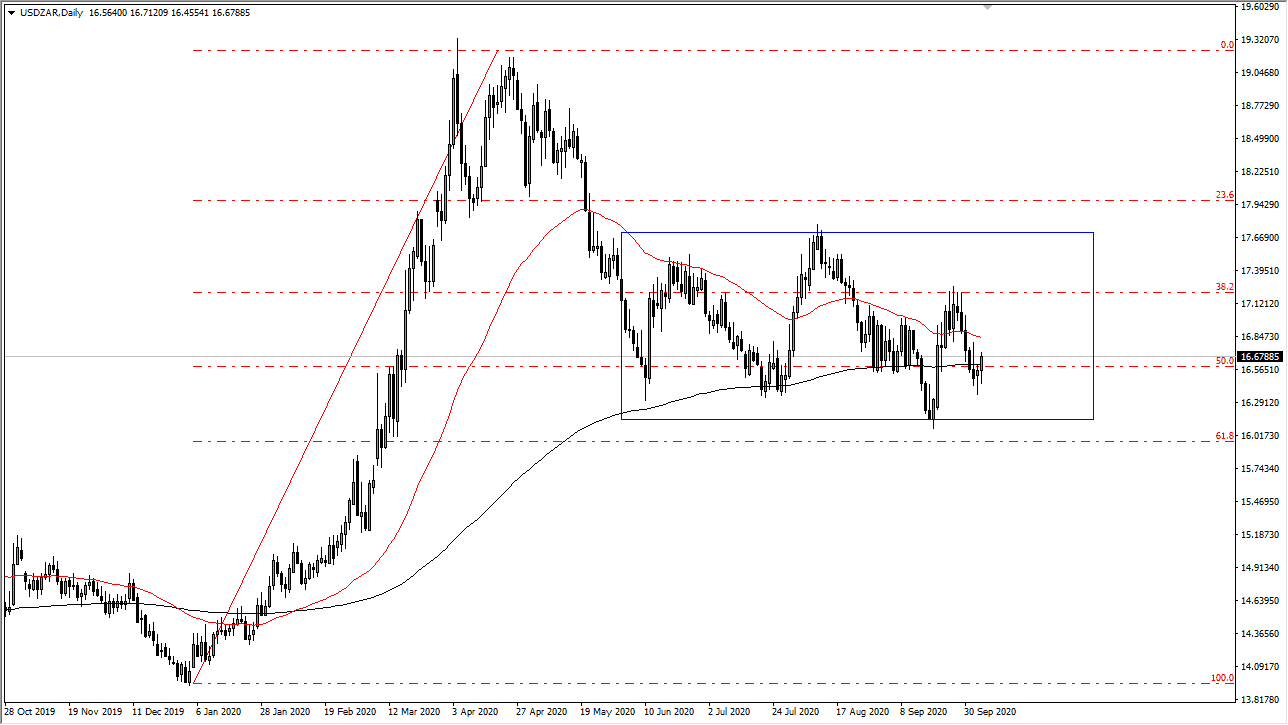
The South African Rand initially tried to rally against the US dollar during the trading session on Tuesday but gave back the gains as we dug into the hammer that the US dollar formed against it on Monday. That being said, there was also a shooting star during the trading session on Friday and the 200 day EMA is slicing through the middle of it. That will attract a certain amount of attention as it is considered to be in a longer-term trend finding tool, and the fact that it is flat tells you that the market essentially is stuck in a range.
If you look out even further, you can see that I have drawn a bit of a rectangle, and I think we are in a very sloppy rectangle right now in the market. The 16.25 Rand level looks to be supportive while the 17.75 level looks to be resistive. (This is a general range, not necessarily something that is going to be tight.) That being said, the market did rally to the upside during the trading session on Tuesday, especially after Donald Trump suggested that he was not willing to have his negotiators negotiate stimulus until after the election as the Democrats were not negotiating in good faith. While this has absolutely nothing to do with the South African Rand, whether or not the US economy picks up due to stimulus as a massive influence on what happens around the world as far as economic activity is concerned.
With that being said it is important to understand that the pair tends to range-bound trade for quite some time, and I think that is what we are going to see. A break above the candlestick for the trading session on Tuesday could send this market looking towards the 17.20 Rand level, possibly even a little higher. To the downside, it looks like there is quite a bit of support near the 16.40 Rand level, and then again at the 16.25 Rand level which is the bottom of the overall range. As long as we have more of a “risk-off” type of attitude around the world, people will be running away from emerging markets and heading towards the safety of the greenback. That is exactly what seems to be going on in this chart right now.

