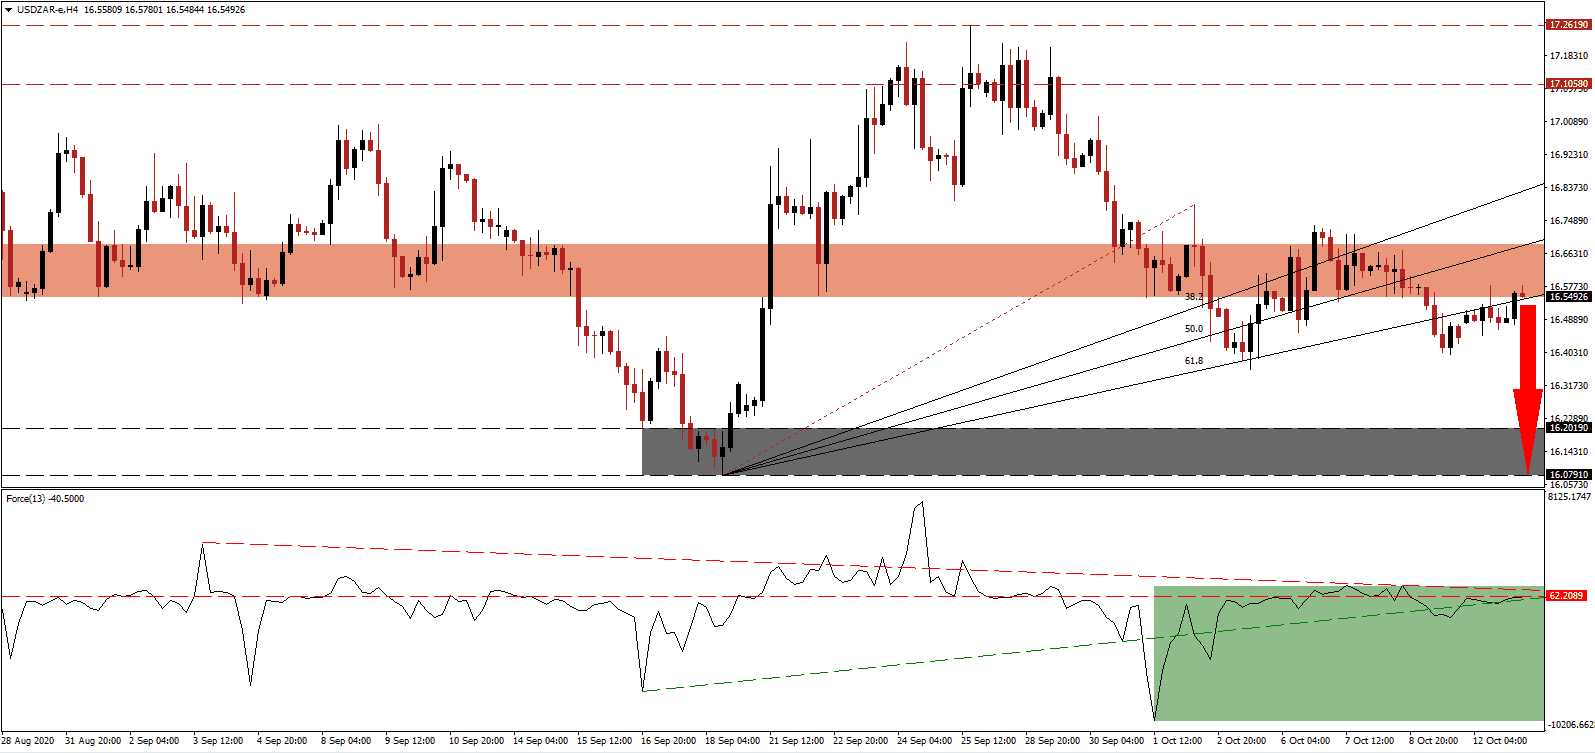
South Africa will report its 700,000th Covid-19 infection this week and has nearly 51,000 active cases. While economic indicators point to a gradual post-lockdown recovery, most of it is due to pent-up demand and unlikely to extend. Yesterday’s August manufacturing data showed a slowdown compared to July but came in above expectations. President Cyril Ramaphosa will present his long-awaited South African Economic Reconstruction and Recovery Plan to a joint session of parliament on October 15th,2020. The USD/ZAR challenges the strength of its short-term resistance zone following its breakdown.
The Force Index, a next-generation technical indicator, was able to move above its ascending support level but remains below its horizontal resistance level. Bearish pressures continue to increase, magnified by its descending resistance level, as marked by the green rectangle. This technical indicator maintains its position below the 0 center-line, ensuring bears hold on to control over price action in the USD/ZAR.
Early indication over the recovery plan highlights a disappointing approach and lack of funding, while it echoes the same failed strategies as before with minor adjustments. It does note the importance of co-existence with Covid-19, and the National Command Council was placed in charge of monitoring and evaluating progress. The short-term resistance zone located between 16.5471 and 16.6873, as identified by the red rectangle, is favored to reject the USD/ZAR, driven by intensifying US Dollar weakness.
Finance Minister Tito Mboweni cautioned against a financial crisis by 2024, unless spending will come under control. His Medium-Term Budget Policy Statement, scheduled for October 21st, will offer more details. With the Covid-19 pandemic ongoing, attacks and murders of farmers continue to pose a significant problem, but President Ramaphosa denies the recent attacks as ethnic cleansing. Civil rights group AfriForum confirmed 292 attacks on rural farmers so far this year, with 38 murders. A collapse in the USD/ZAR below its ascending 61.8 Fibonacci Retracement Fan Support Level will allow this currency pair to correct into its support zone between 16.0791 and 16.2019, as marked by the grey rectangle.
USD/ZAR Technical Trading Set-Up - Breakdown Scenario
Short Entry @ 16.5500
Take Profit @ 16.0800
Stop Loss @ 16.6500
Downside Potential: 4,700 pips
Upside Risk: 1,000 pips
Risk/Reward Ratio: 4.70
Should the Force Index advance, driven higher by its ascending support level, the USD/ZAR may extend its reversal. Given the ongoing US Dollar weakness, exacerbated by a weak labor market, debt, and planned localized lockdowns, Forex traders should sell any rallies. The upside potential remains reduced to its intra-day high of 16.7926, the end-point of its Fibonacci Retracement Fan sequence.
USD/ZAR Technical Trading Set-Up - Reduced Breakout Scenario
Long Entry @ 16.7000
Take Profit @ 16.7900
Stop Loss @ 16.6500
Upside Potential: 900 pips
Downside Risk: 500 pips
Risk/Reward Ratio: 1.80

