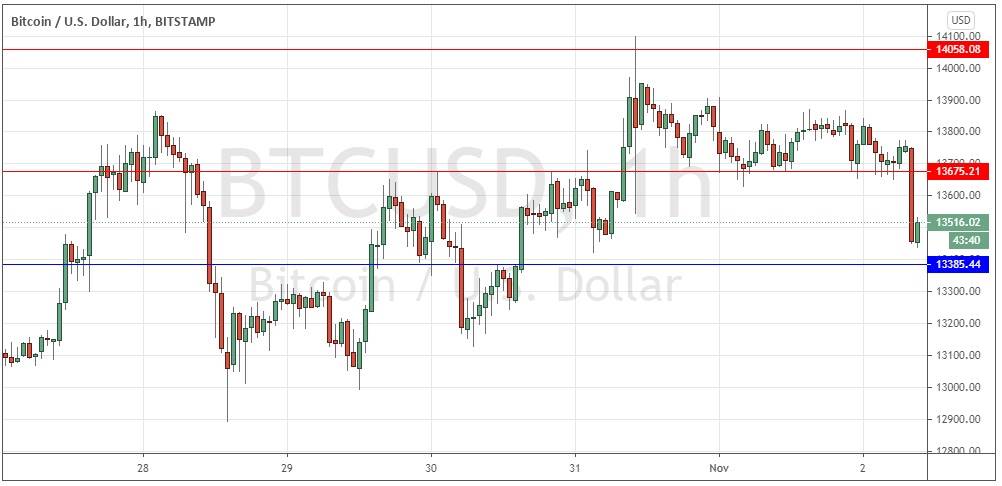
Last Thursday’s signals were not triggered, as there was no bearish price action when the two resistance levels which were hit were first reached.
Today’s BTC/USD Signals
Risk 0.50% per trade.
Trades must be entered before 5pm Tokyo time Tuesday.
Long Trade Idea
Go long after a bullish price action reversal on the H1 time frame following the next touch of $13,385.
Place the stop loss $50 below the local swing low.
Move the stop loss to break even once the trade is $50 in profit by price.
Take off 50% of the position as profit when the trade is $50 in profit by price and leave the remainder of the position to run.
Short Trade Ideas
Go short after a bearish price action reversal on the H1 time frame following the next touch of $13,675 or $14,058.
Place the stop loss $50 above the local swing high.
Move the stop loss to break even once the trade is $50 in profit by price.
Take off 50% of the position as profit when the trade is $50 in profit by price and leave the remainder of the position to run.
The best method to identify a classic “price action reversal” is for an hourly candle to close, such as a pin bar, a doji, an outside or even just an engulfing candle with a higher close. You can exploit these levels or zones by watching the price action that occurs at the given levels.
BTC/USD Analysis
I wrote last Thursday that I saw the resistance zone just above the price area from $13,485 to $13,330 as likely to be very pivotal. I also wanted to take a long trade if we had gotten two consecutive hourly closes later above $13,485.
The latter scenario played out and produced a little more than $200 of profit so this was not a bad call.
I have been generally bullish on Bitcoin lately for two reasons. Firstly, because it has been breaking to new long-term highs; secondly, because it has been showing strength even when stock markets have been selling off, suggesting it is losing its usual correlation with “risk” assets and becoming more of the kind of hedge its enthusiasts want to see it as.
The technical picture now is a bit less bullish as the price pulls back and prints some new lower resistance levels, most notably at $13,675. As long as the price stays above the support level at $13,385, then all we have is a shallow bearish retracement which does not change the bullish picture, so this is likely to be today’s pivotal point.
I will be happy to take a long trade from a bullish bounce at $13,385. If the price gets established below that level, it could drop quite fast.
Regarding the USD, there will be a release of ISM Manufacturing data at 3pm London time.
