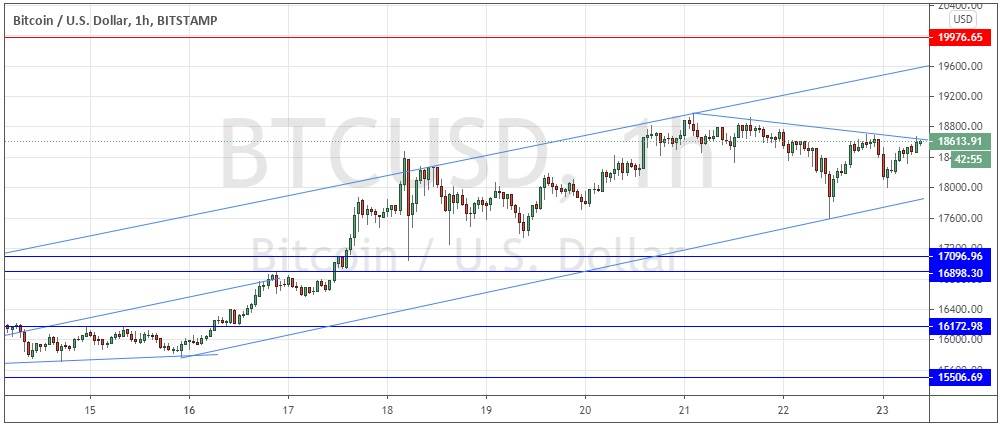
Last Thursday’s signals were not triggered as there was insufficiently bearish price action at both $18,000 and $18,411.
Today’s BTC/USD Signals
Risk 0.50% per trade.
Trades must be entered prior to 5pm Tokyo time Tuesday.
Long Trade Ideas
Go long after a bullish price action reversal on the H1 time frame following the next touch of $17,097, $16,898, or $16,173.
Place the stop loss $50 below the local swing low.
Move the stop loss to break even once the trade is $50 in profit by price.
Take off 50% of the position as profit when the trade is $50 in profit by price and leave the remainder of the position to run.
Short Trade Ideas
Go short after a bearish price action reversal on the H1 time frame following the next touch of $19,977, or $20,000.
Place the stop loss $50 above the local swing high.
Move the stop loss to break even once the trade is $50 in profit by price.
Take off 50% of the position as profit when the trade is $50 in profit by price and leave the remainder of the position to run.
The best method to identify a classic “price action reversal” is for an hourly candle to close, such as a pin bar, a doji, an outside or even just an engulfing candle with a higher close. You can exploit these levels or zones by watching the price action that occurs at the given levels.
BTC/USD Analysis
I wrote last Thursday that the situation here had become more bearish as markets moved into risk-off sentiment mode. A sign of this was the new lower resistance level forming confluent with the round number at $18,000.
I thought that the price was likely to remain between $18,000 and $16,898 over the day.
This was not a bad call as the price did mostly go sideways, but it did move with a bullish bias and spent time above my upper limit at $18,000.
I see a mixed technical picture for Bitcoin today. On one hand, we have the price close to a record high and well established within a symmetrical bullish price channel which is drawn within the price chart below. We have also seen the invalidation of the lower resistance levels and now we have no clear resistance until the all-time high price just below $20,000 is reached.
On the other hand, we do see topping price action at the highs over the medium term, with the price being held down by an internal bearish descending trend line.
A breakout above this bearish trend line could be a signal for a long trade entry, but I prefer to stand aside and wait for some new support to develop before taking any long trade.
In the unlikely but possible event that the price quickly shoots up to $20,000 I think there would probably be an excellent (even if maybe short-term) short trade from there. There is nothing of high importance scheduled today concerning the USD.
