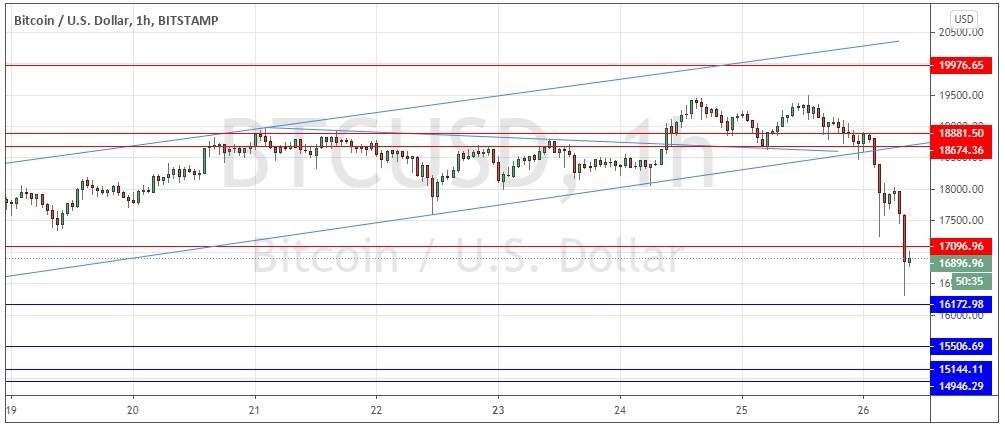
Yesterday’s signals produced a losing long trade entry from the bullish bounce at $18,674.
Today’s BTC/USD Signals
Risk 0.50% per trade.
Trades must be taken before 5pm Tokyo time Friday.
Long Trade Ideas
Long entry after a bullish price action reversal on the H1 time frame following the next touch of $17,097, $16,898, $16,173, or $15,507.
Put the stop loss $50 below the local swing low.
Adjust the stop loss to break even once the trade is $50 in profit by price.
Remove 50% of the position as profit when the trade is $50 in profit by price and leave the remainder of the position to ride.
Short Trade Ideas
Short entry after a bearish price action reversal on the H1 time frame following the next touch of $18,674, or $18,882.
Put the stop loss $50 above the local swing high.
Adjust the stop loss to break even once the trade is $50 in profit by price.
Remove 50% of the position as profit when the trade is $50 in profit by price and leave the remainder of the position to ride.
The best method to identify a classic “price action reversal” is for an hourly candle to close, such as a pin bar, a doji, an outside or even just an engulfing candle with a higher close. You can exploit these levels or zones by watching the price action that occurs at the given levels.
BTC/USD Analysis
I wrote yesterday that the higher prices being made over the day plus the printing of a confluent flipped resistance to support level at $18,674 were bullish signs. However, I also mentioned that we were very close to the all-time high price just below $20,000 which may act as strong resistance, as may the actual big round number there itself.
This was an OK call as although the price did not quite reach the key resistance level identified at $19,977, it has fallen strongly after getting near that area. The fall has been sharp and sudden and was evidenced technically by the strong break below the former bullish price channel which can still be seen in the price chart below. The move down has broken cleanly through a couple of former support levels, flipping them to become new probable resistance, and invalidating another former support level.
It is difficult to forecast how much further the price is likely to move down, but the strong bullish move is very likely to be over, at least for now. The question is whether the price is arriving at an area which could be a good buying opportunity. I think buying opportunities are not likely to happen until the price hits the support level identified at $15,507 because it is near a major round number and also it marks the start of a cluster of support levels which are technically likely to act together as effective support.
I would be happy to take a long trade here today if the price reaches $15,507 or below and makes a firm bullish bounce there.
There is nothing of high importance due today regarding the USD. It is a public holiday in the U.S. today.


