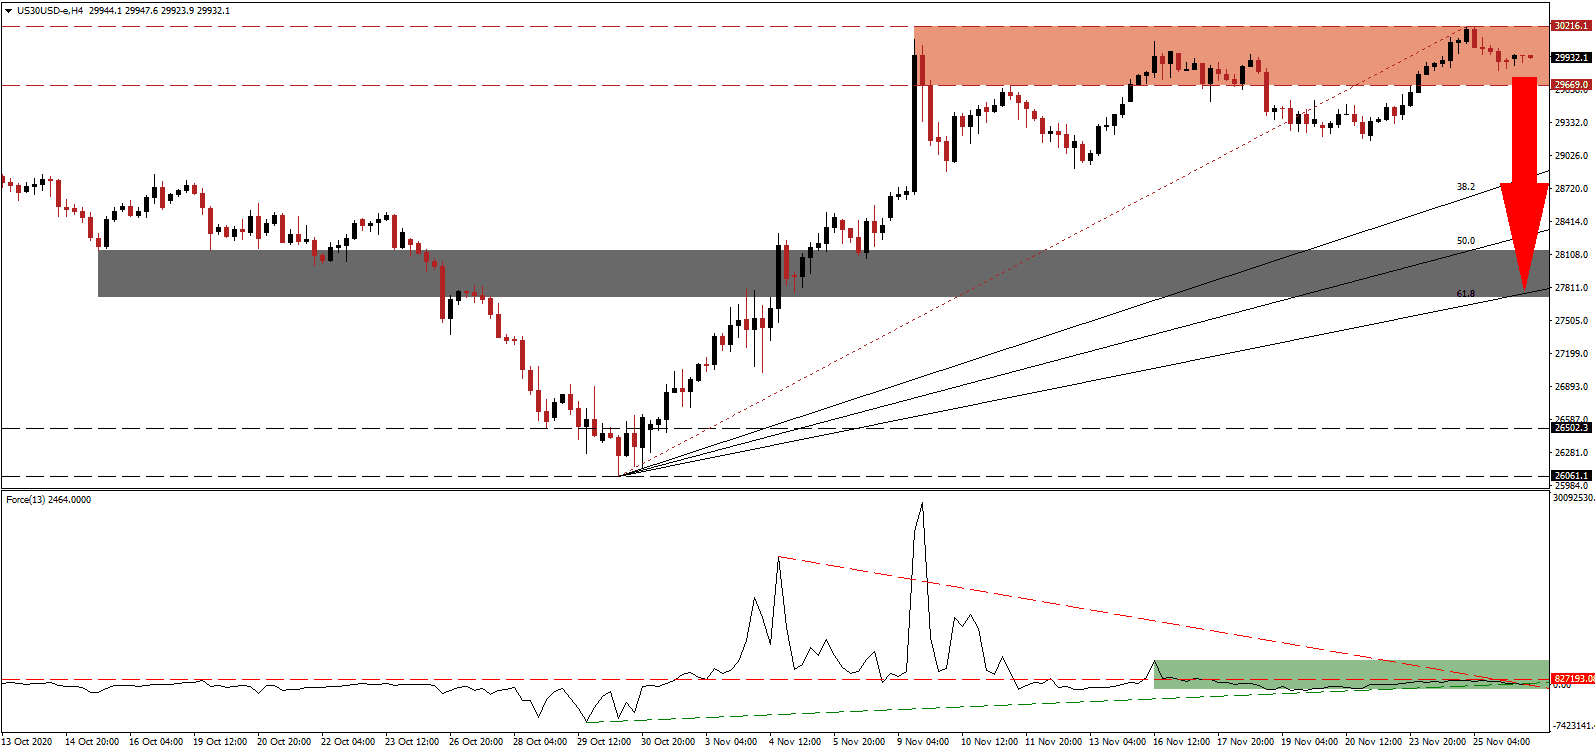
Despite the second wave of the COVID-19 pandemic pushing new daily infections in the US close to 200,000, the Dow Jones Industrial Average (DJIA) recorded an all-time high above 30,000. The US crossed 13,000,000 infections with more than 5,000,000 active cases. Investors continue to buy and hope that a vaccine will cure the problems while ignoring unsustainable debt and weakening economic indicators. The DJIA is vulnerable to a profit-taking sell-off inside its resistance zone.
The Force Index, a next-generation technical indicator, confirms the lack of bullish momentum. It leaves the descending resistance level in a dominant position, set to result in a breakdown below its ascending support level. With the Force Index below its horizontal resistance level, as marked by the green rectangle, bears wait for this technical indicator to cross below the 0 center-line for full control of price action in the DJIA.
With more localized lockdowns on the rise across the US, weekly initial jobless claims rose well above expectations for a decrease with an upward revision to the previous week. Personal income unexpectedly contracted, potentially harming an already uncertain holiday shopping season. The DJIA, consisting of 30 bluechip companies, risks a sharp reversal with a pending breakdown below its resistance zone located between 29,669.0 and 30,216.1, as marked by the red rectangle.
Optimism over a COVID-19 vaccine added to the massive rally across global equities, but 2021 is well-positioned to deliver below-average growth rates. Weaker global GDP will apply significant downside pressure on export-oriented mega-cap equities. Fiscal stimulus remains the primary growth catalyst, which is an unhealthy and unsustainable development. A collapse in the DJIA from present levels will accelerate its pending correction into its short-term support zone located between 27,718.6 and 28,147.3, as identified by the grey rectangle. The ascending 61.8 Fibonacci Retracement Fan Support Level enforces it.
DJIA Technical Trading Set-Up - Profit-Taking Scenario
Short Entry @ 29,935.0
Take Profit @ 27,735.0
Stop Loss @ 30,435.0
Downside Potential: 22,000 points
Upside Risk: 5,000 points
Risk/Reward Ratio: 4.40
A breakout in the Force Index above its descending resistance level can result in a price spike in the DJIA. Given intensifying bearish developments for the US economy, traders should consider any advance a selling opportunity. The Santa Clause rally came early in 2020, and the upside potential remains confined to its next calculated resistance zone between 30,820.4 and 31,122.6.
DJIA Technical Trading Set-Up - Confined Breakout Scenario
Long Entry @ 30,670.0
Take Profit @ 31,000.0
Stop Loss @ 30,435.0
Upside Potential: 3,300 points
Downside Risk: 2,350 points
Risk/Reward Ratio: 1.40


