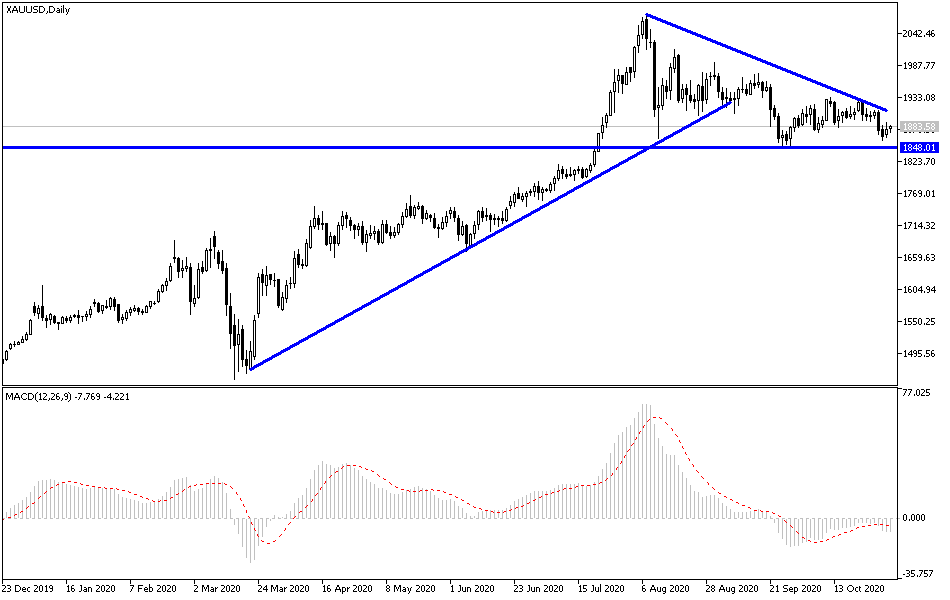
After the recent drop in gold prices, investors are anticipating an upward rebound and awaiting the best opportunity to buy. As the recent strength of the US dollar prevented its rise, the price of gold settled below the $1900 resistance level, the most important level for the bulls to control long-term performance. I still prefer to buy gold from every drop. This week would be a good time to wait for the opportunity to go long, as markets are waiting for important events to occur that have an unlimited return on the metal markets: the US presidential elections, the power of the second coronavirus wave and the global restrictions to contain it, as well as the announcement of US employment numbers and the monetary policy from global central banks, including the Federal Reserve.
The technical outlook for gold is neutral as the XAU/USD pair faces mixed problems. In September, the near-term 20-day SMA (simple moving average) broke below the 50-day SMA. This shape of the descending "Death Cross" has already been confirmed. After the formation and some initial weakness, the price of gold made some cautious gains. However, the 50-day SMA has held as resistance along bearish territory since August.
Following a sharp drop during two trading sessions during which the price of gold collapsed to $1860 an ounce, gold prices rose again towards $1890 an ounce before closing trading steadily around $1878 an ounce. Gold prices maintained their gains despite the dollar's recovery, as the precious metal continues to benefit from its appeal as a safe haven amid the continuous rise in coronavirus cases.
The number of new COVID-19 cases in the United States has reached a new record high, as health experts expect future cases and death rates to triple by mid-January. 88,521 new coronavirus cases were reported in the United States on Thursday, according to data from Johns Hopkins University, which is an increase of 9,540 cases compared to Wednesday.
Meanwhile, investors shrugged off some upbeat economic data, as a report from the US Commerce Department showed that personal income rebounded more than expected in September. A separate report from the University of Michigan showed a slight improvement in consumer confidence than initially expected in October.
Technical analysis of gold:
On the daily chart, the price of gold is closest to testing the lower line of the triangle formation. This is an opportunity to think about buying and waiting for the rebound phase as the technical indicators begin to give indications of strong selling saturation. Accordingly, the support levels at 1866, 1850 and 1832 dollars will be the most suitable ones for buying at the present time. On the upside, crossing the $1900 resistance barrier is still important for the bulls to take control and start testing resistance levels that enable it to shift the current bearish outlook. We can expect a subsequent rebound towards the resistance levels at 1916, 1930 and 1945, respectively, from which the current bearish outlook will change completely.
The price of gold will interact today, along with the extent of investor’s risk, with the strength of the USD and the announcement of the industrial PMI reading from Japan, the Eurozone, Britain and the United States of America.

