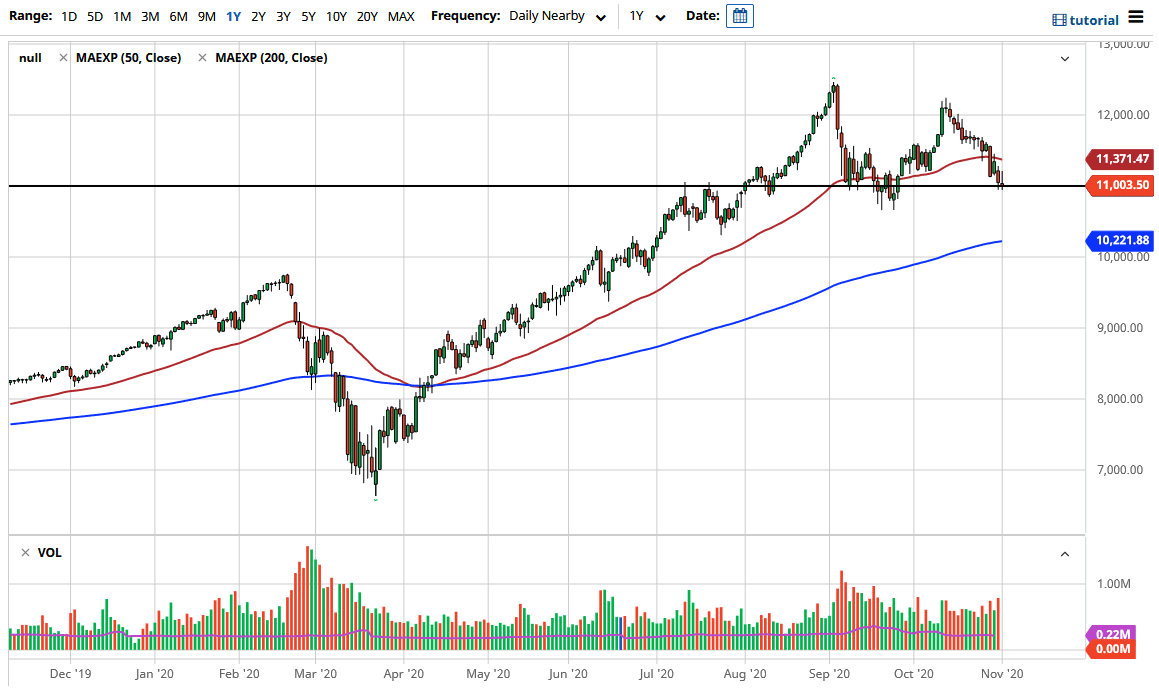
The NASDAQ 100 initially shot higher during the trading session on Monday, but then pulled back to form an inverted hammer. If we can break down below the bottom of the candlestick, then it suggests that we could go down towards the support at 10,600 or so. If we break down below there, then the market goes looking towards the 200 day EMA at the 10,200 level.
The NASDAQ 100 is in the process of trying to form an “M pattern”, which is a negative pattern. It suggests that perhaps we are trying to form a “double top”, which despite having been around a while, is not actually confirmed until you break down below the dip to make a “lower low.” We have not done that and, even if we did, I would not be a seller. The NASDAQ 100 is highly levered to a handful of companies that everybody loves. The 200-day EMA sits at the 10,222 level, and the 10,000 level should offer support right along with it as well. This is a market that I prefer to buy, so if we do break down in this market, I believe that you are better off buying the US dollar.
If we break above the top of the candlestick for the trading session on Monday, then it will be a confirmed “inverted hammer”, which would send this market much higher. It could be looking towards the 50-day EMA, and then the 11,500 level. Breaking above that opens up the possibility of a return to the top of the overall consolidation, which is near the 12,000 level. The market breaking above there would be a “rip your face off rally” - suggesting that the election had a finalized election result rather quickly. I think we get a lot of back-and-forth and therefore have a couple of levels that we should be watching. I am not a seller of the NASDAQ 100, as it is only a matter of time before it turns around based upon either the Federal Reserve bailing out everyone, or a congressional freefall of free money.


