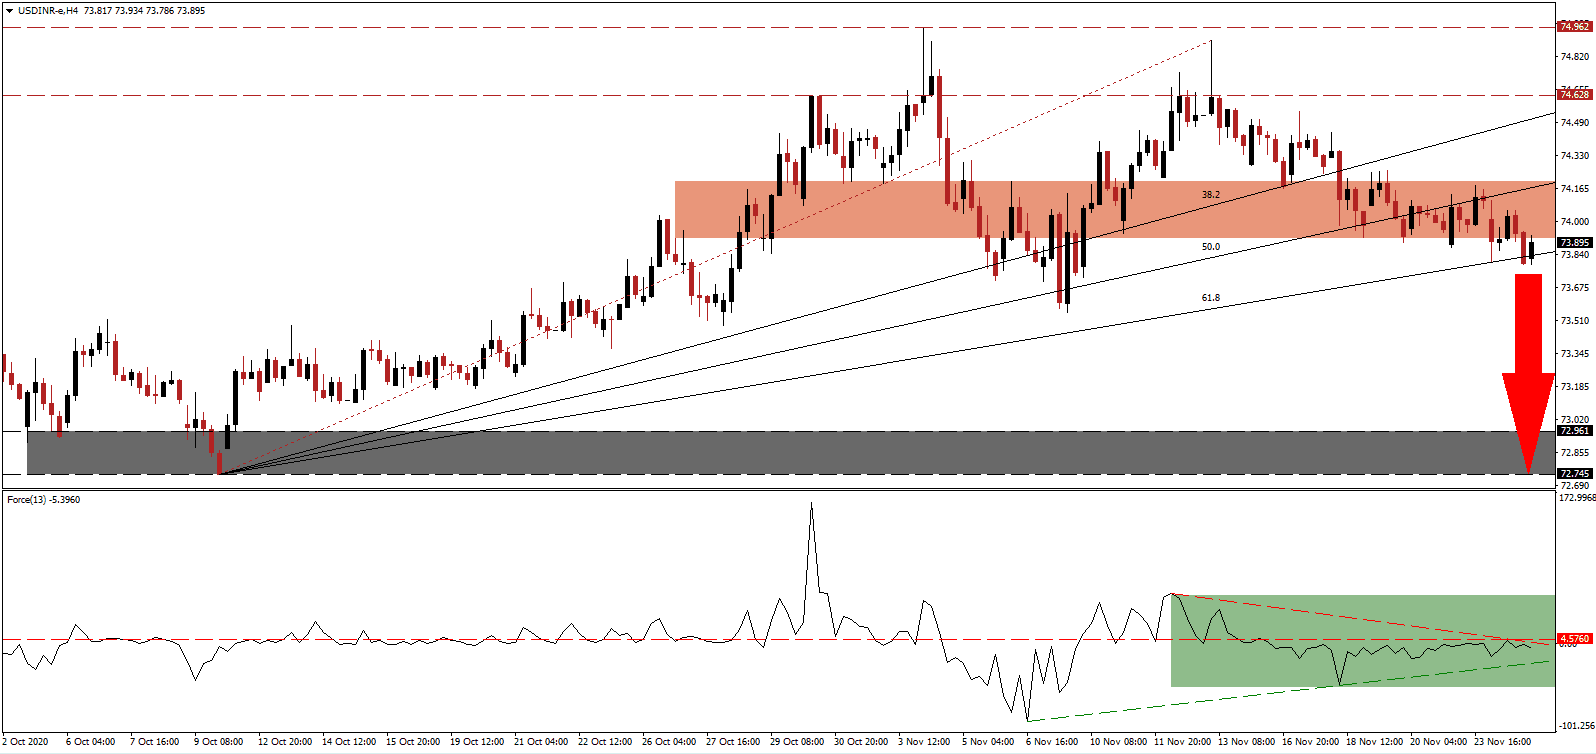
While new daily COVID-19 infections soar around the world during the second wave of the pandemic, optimism increases over an economic recovery. Premature vaccine-related news may result in disappointment. India benefited from domestic demand during the October festival season, lifting three out of the eight high-frequency indicators tracked to gauge the state of the economy. The USD/INR extended its breakdown sequence below its short-term resistance zone with more room to the downside.
The Force Index, a next-generation technical indicator, confirms the dominance of bearish momentum, magnified by its descending resistance level. After a minor drift higher, the horizontal resistance level kept the downtrend intact, as marked by the green rectangle. This technical indicator is on course to move below its ascending support level and further into negative territory, granting bears complete control over the USD/INR.
Inflation remains high, and the Reserve Bank of India (RBI) monitors supply-side driven pressures closely. Monetary Policy Member (MPC) Mridul Saggar confirmed that further easing by the central bank will become an option only after inflation is under control. The RBI has an inflation target between 2.0% and 6.0%. Following the breakdown in the USD/INR below its short-term resistance zone located between 73.916 and 74.200, as marked by the red rectangle, an acceleration to the downside can materialize.
India will likely print a GDP expansion in the fourth quarter of 2020, and over 70,000 exporters pin their hopes on the Christmas shopping season. Despite the short-term optimism, India opted to stay out of the Regional Comprehensive Economic Partnership (RCEP), which can limit future growth. A collapse in the USD/INR through its ascending 61.8 Fibonacci Retracement Fan Support Level will clear the path into its support zone located between 72.745 and 72.961, as identified by the grey rectangle.
USD/INR Technical Trading Set-Up - Breakdown Acceleration Scenario
Short Entry @ 73.900
Take Profit @ 72.750
Stop Loss @ 74.250
Downside Potential: 11,500 pips
Upside Risk: 3,500 pips
Risk/Reward Ratio: 3.29
Should the Force Index sustain a move above its descending resistance level, the USD/INR could enter a brief reversal. The upside potential remains confined to its resistance zone between 74.628 and 74.962. Misplaced economic optimism in the US, together with a destructive long-term monetary policy, provide bearish pressures on the US dollar. Therefore, Forex traders should sell any rallies from present levels.
USD/INR Technical Trading Set-Up - Confined Reversal Scenario
Long Entry @ 74.550
Take Profit @ 74.900
Stop Loss @ 74.250
Upside Potential: 3,500 pips
Downside Risk: 3,000 pips
Risk/Reward Ratio: 1.17

