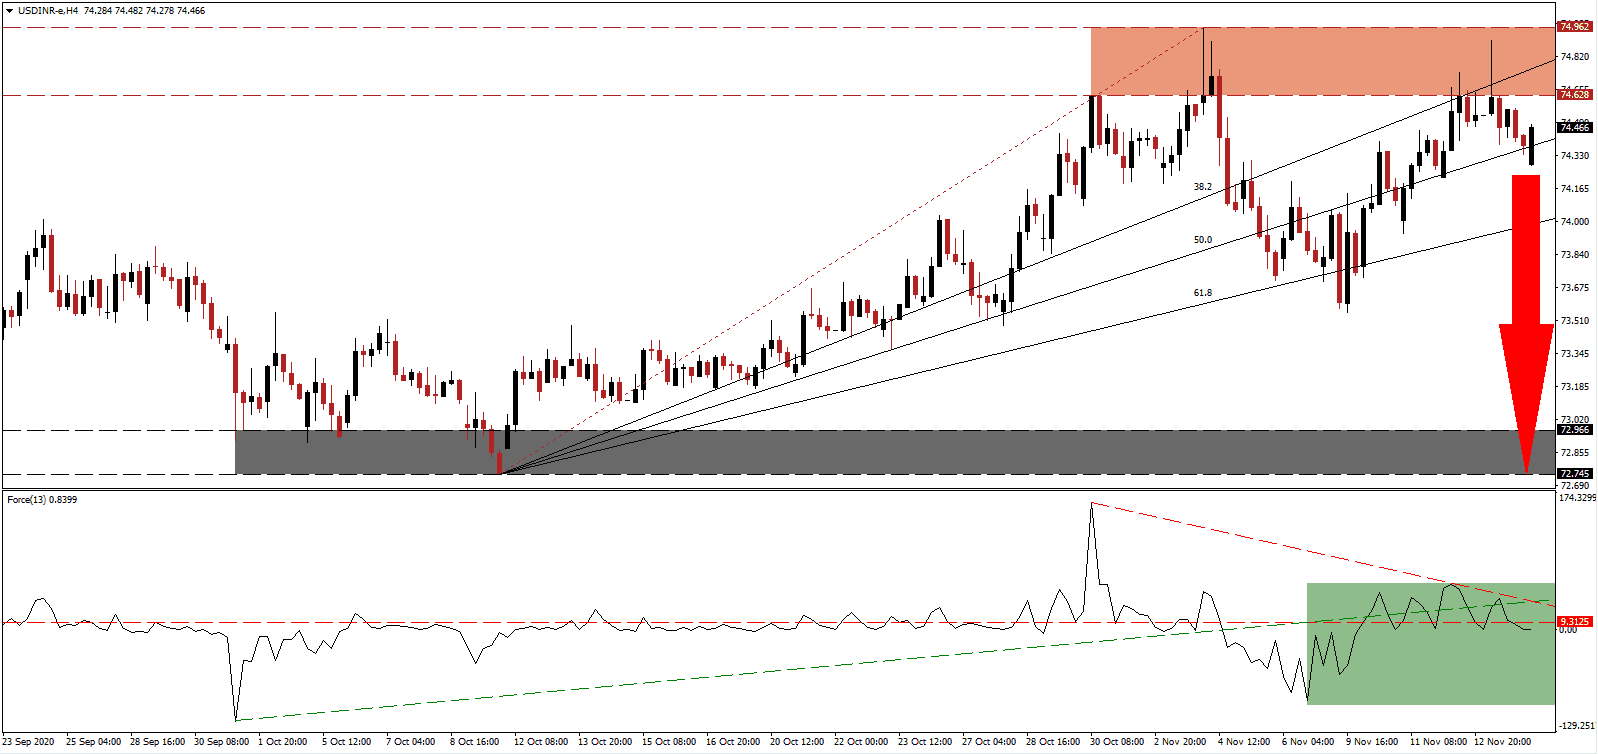
India watched from the sidelines as the world's largest trade deal was signed. Fourteen countries signed the Regional Comprehensive Economic Partnership (RCEP), which excluded India after it pulled out of negotiations amid worries over an inflow of cheaper Chinese products. By 2030, RCEP is forecast to account for 50% of global trade, up from the current 30%. India's decision to walk away will likely result in a decrease in GDP potential. The USD/INR completed a breakdown below its resistance zone, magnifying downside pressures.
The Force Index, a next-generation technical indicator, remains below its ascending support following a brief spike above it and has now retreated below its horizontal resistance level, as marked by the green rectangle. Adding to bearish momentum is the descending resistance level, on course, to guide this technical indicator below the 0 center-line. It will grant bears complete control over the USD/INR.
A series of economic assessments, including from Oxford Economics and Moody's Investors Service, suggest the Indian economic recovery is faster than previously outlined. The latter increased the 2020 GDP outlook from a plunge of 9.6% to 8.9%. It also raised the 2021 outlook from an increase of 8.1% to 8.6%. After moving below its resistance zone located between 74.628 and 74.962, as identified by the red rectangle, the USD/INR presently challenges its ascending 50.0 Fibonacci Retracement Fan Resistance Level.
Real negative interest rates and high inflation add a bullish catalyst to the Indian rupee, as the Reserve Bank of India (RBI) is unlikely to deliver an interest rate cut. Prime Minister Narendra Modi continues to attempt to lure foreign direct investment to rebuild the post-COVID-19 economy. Despite being outside of RCEP, the USD/INR is well-positioned, on the back of US dollar weakness, to accelerate into its support zone between 72.745 and 72.966, as marked by the grey rectangle.
USD/INR Technical Trading Set-Up - Breakdown Extension Scenario
Short Entry @ 74.500
Take Profit @ 72.750
Stop Loss @ 74.900
Downside Potential: 17,500 pips
Upside Risk: 4,000 pips
Risk/Reward Ratio: 4.38
A breakout in the Force Index above its ascending support level, serving as short-term resistance, may lead the USD/INR into a secondary push higher. Given the deteriorating COVID-19 pandemic in the US with the prospects of more debt, the outlook for the US dollar remains bearish. Forex traders should sell any rallies from current levels, with the upside potential reduced to its intra-day high of 75.330.
USD/INR Technical Trading Set-Up - Reduced Breakout Scenario
Long Entry @ 75.050
Take Profit @ 75.300
Stop Loss @ 74.900
Upside Potential: 2,500 pips
Downside Risk: 1,500 pips
Risk/Reward Ratio: 1.67

