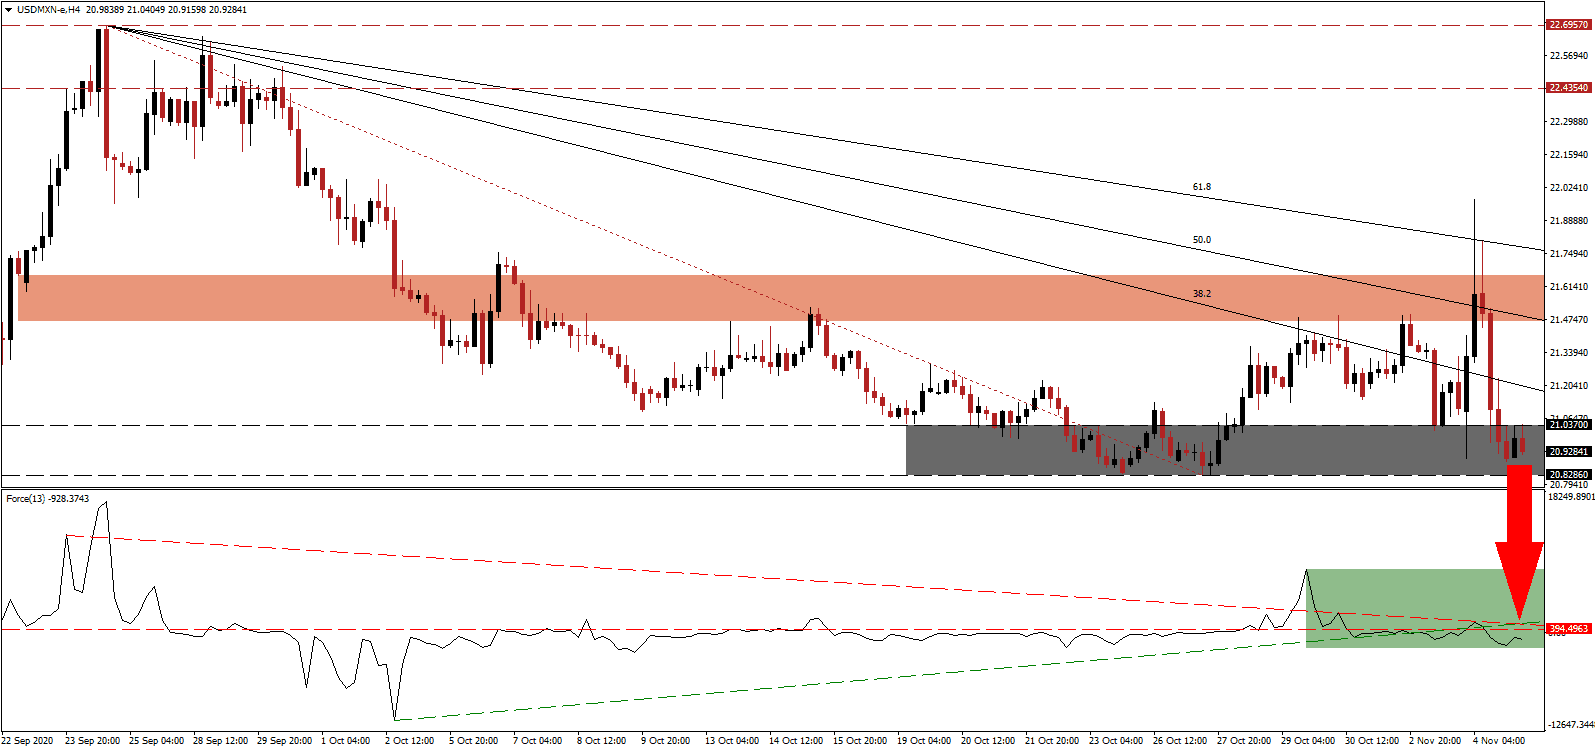
With Mexico on course to become the latest country with over 1,000,000 confirmed Covid-19 infections, the short-term focus remains on s clear outcome from the 2020 US presidential election. The neck-on-neck race between incumbent President Trump and Democratic challenge Biden, which Trump led early on, but Biden now leads in the final stretch, appears to end in a legal battle over the state of Michigan. The winner will determine the relationship between Mexico and the US, which soured over the past four years. Volatility in the USD/MXN spiked before retreating into its support zone.
The Force Index, a next-generation technical indicator, recorded a lower high above its horizontal resistance level before reversing below its ascending support level. Bearish momentum continues to increase, magnified by its descending resistance level, as marked by the green rectangle. This technical indicator slides deeper into negative territory, strengthening bearish control over the USD/MXN.
After Mexican President López Obrador announced a $297 billion infrastructure plan to kickstart the economy and spur job creation in partnership with the private sector, business confidence remains low for now. The lack of opportunities for investment and the recent move to bring the energy sector under complete government control discourage private investment. Once more clarity becomes visible, it could provide a much-needed catalyst. The USD/MXN briefly spiked above its short-term resistance zone located between 21.4698 and 21.6595, as identified by the red rectangle, before starting a new breakdown sequence.
Despite requests by President López Obrador for international institutions to respect the sovereignty of Mexico and to stop meddling with its domestic economy, the US-based International Monetary Fund (IMF) urged tax reforms to support spending. Remittances continue to grow and assist low-income families, providing a direct economic boost. The collapse in the USD/MXN below its descending 38.2 Fibonacci Retracement Fan Support Level took it into its support zone between 20.8286 and 21.037, as marked by the grey rectangle. A breakdown extension into its next support zone between 19.8919 and 20.2760 remains a distinct possibility.
USD/MXN Technical Trading Set-Up - Breakdown Extension Scenario
Short Entry @ 20.9300
Take Profit @ 19.9000
Stop Loss @ 21.2400
Downside Potential: 10,300 pips
Upside Risk: 3,100 pips
Risk/Reward Ratio: 3.32
Should the Force Index reclaim its ascending support level, serving as resistance, the USD/MXN may attempt to retrace the most recent contraction. The upside potential remains limited to its 61.8 Fibonacci Retracement Fan Resistance Level, which will grant Forex traders a secondary short-selling opportunity. Until the announcement of a clear winner of the US presidential election, more volatility is ahead.
USD/MXN Technical Trading Set-Up - Limited Retracement Scenario
Long Entry @ 21.4700
Take Profit @ 21.7400
Stop Loss @ 21.2400
Upside Potential: 2,700 pips
Downside Risk: 2,300 pips
Risk/Reward Ratio: 1.17

