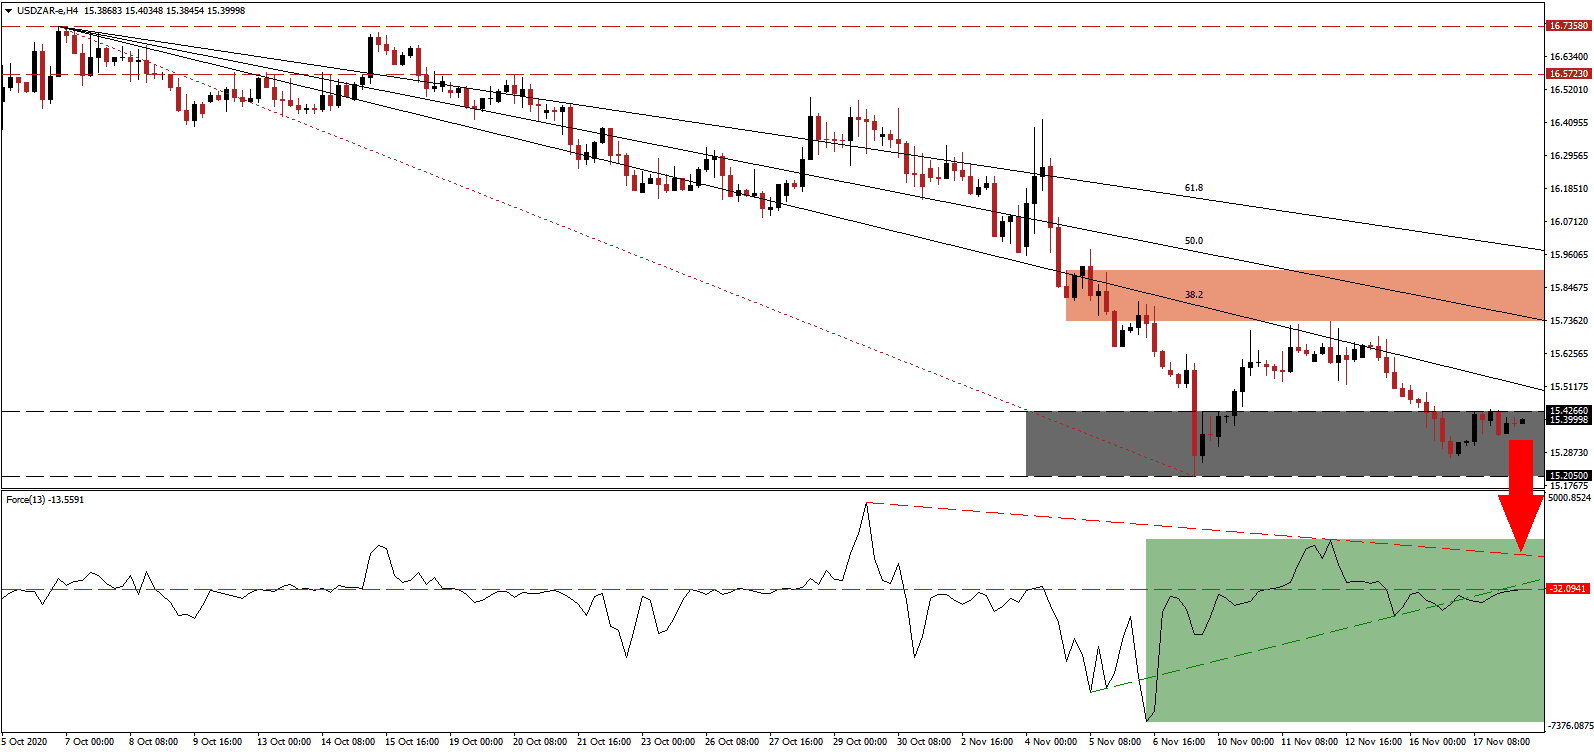
With the second wave of the COVID-19 pandemic accelerating globally, President Cyril Ramaphosa calls on BRICS (Brazil, Russia, India, China, and South Africa) to strengthen trade and investment. The COVID-19 pandemic forces permanent changes to the global supply chain, and most economies took the opportunity for a recalibration of existing models. While President Ramaphosa lobbied for expanded investment across the entire African continent, the manufacturing sector remained a distinct focus. The USD/ZAR reached its support zone from where more downside is possible amid dominant bearish pressures.
The Force Index, a next-generation technical indicator, started to drift higher and challenges its horizontal resistance level. It remains below its ascending support level, as marked by the green rectangle, and the descending resistance level adds to increasing downside momentum. Bears maintain full control over the USD/ZAR with this technical indicator below the 0 center-line.
Adding to economic optimism is the anticipated success of the third South Africa Investment Conference (SAIC). The previous two resulted in investments worth $42 billion, with several projects complete. Ndabezinhle Mkhize, the CEO of the Eskom Pension & Provident Fund, South Africa's second-largest pension fund, added that now is the time to buy South Africa Inc. The breakdown in the USD/ZAR below its short-term resistance zone located between 15.7317 and 15.9070, as marked by the red rectangle, magnified the bearish chart pattern.
After the South African Reserve Bank (SARB) cut interest rates to 3.50% in 2020 - down 300 basis points - the central bank may deliver a final interest rate cut in 2020. The depreciation of the US dollar and low consumer inflation support more easing. Governor Lesetja Kganyago may delay it until 2021, which will boost the South African rand in the short term. The descending 38.2 Fibonacci Retracement Fan Resistance Level can force the USD/ZAR below its support zone located between 15.2050 and 15.4266, as identified by the grey rectangle. The next support zone awaits between 14.5932 and 14.7294.
USD/ZAR Technical Trading Set-Up - Breakdown Extension Scenario
Short Entry @ 15.3950
Take Profit @ 14.5950
Stop Loss @ 15.6250
Downside Potential: 8,000 pips
Upside Risk: 2,300 pips
Risk/Reward Ratio: 3.48
In case the Force Index accelerates through its descending resistance level, the USD/ZAR may spike higher. Forex traders should consider any advance as a selling opportunity due to deteriorating economic conditions across the US. More lockdowns and restrictions will harm activity in the short term, as evidenced in retail sales and regional indicators. The upside potential remains confined to its 61.8 Fibonacci Retracement Fan Resistance Level.
USD/ZAR Technical Trading Set-Up - Confined Breakout Scenario
Long Entry @ 15.7850
Take Profit @ 15.9650
Stop Loss @ 15.6250
Upside Potential: 1,800 pips
Downside Risk: 1,600 pips
Risk/Reward Ratio: 1.13

