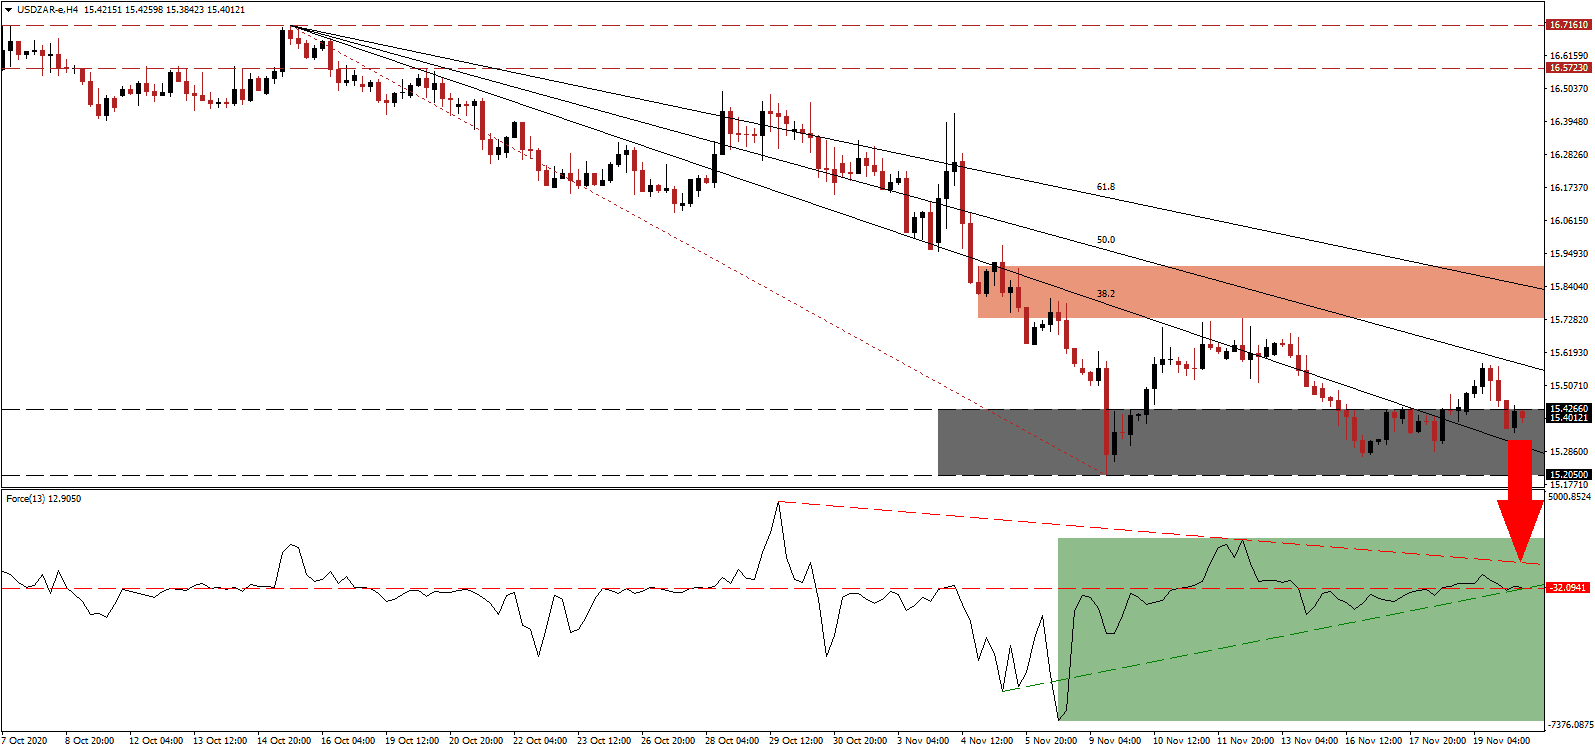
South African President Cyril Ramaphosa tried to drum up support for foreign direct investment during the third South Africa Investment Conference (SAIC). While he claimed investor appetite to take advantage of future growth prospects in South Africa, the result were pledges from 50 companies for a total of R109.6 billion. It fell well short of the ambitions R1.2 trillion President Ramaphosa targeted. The USD/ZAR revered a minor reversal above its support zone, and a pending breakdown can accelerate the correction.
The Force Index, a next-generation technical indicator, drifted above its horizontal resistance level, as marled by the green rectangle, but is now on course to move below its and its ascending support level. Increasing breakdown pressures is the descending resistance level. Bears wait for this technical indicator to cross below the 0 center-line to regain complete control over the USD/ZAR.
During the last Monetary Policy Committee (MPC) of the South African Reserve Bank (SARB), Governor Lesetja Kganyago kept interest rates unchanged at 3.50%. The central bank revised its third-quarter GDP forecast up to reflect a rebound of 50.3% and a 2020 FDP drop of 8.0%. He also signaled the next move by SARB would be a series of interest rate increases in the second half of 2021. It kept the bearish chart pattern in the USD/ZAR intact, with the short-term resistance zone located between 15.7317 and 15.9070, as identified by the red rectangle pending a downward revision.
A reintroduced bill to nationalize SARB drew criticism from Ismail Momomiat, Deputy Director-General at the National Treasury, confirming it sends a negative message to investors. Julius Malema, the leader of the Economic Freedom Fighters (EFF), initially introduced it in 2018. September retail sales decreased by 2.7% year-over-year, following a revised contraction of 4.1% in August. Month-over-month, they rose by 1.1% in September, adding to the 4.0% expansion in August and the 0.6% rise in July. The USD/ZAR is on course to move below its support zone located between 15.2050 and 15.4266, as marked by the grey rectangle. The descending Fibonacci Retracement Fan sequence maintains bearish pressures, with the next support zone located between 14.5932 and 14.7294.
USD/ZAR Technical Trading Set-Up - Breakdown Extension Scenario
- Short Entry @ 15.4000
- Take Profit @ 14.6000
- Stop Loss @ 15.6000
- Downside Potential: 8,000 pips
- Upside Risk: 2,000 pips
- Risk/Reward Ratio: 4.00
Should the Force Index move above its descending resistance level, the USD/ZAR could attempt another advance. The upside potential remains reduced to its intra-day high of 15.9783, presenting Forex traders with a secondary short-selling opportunity. New Covid-19 infection across the US approach 200,000 per day, and initial jobless claims, as well as retail sales, disappointed.
USD/ZAR Technical Trading Set-Up - Reduced Breakout Scenario
- Long Entry @ 15.7500
- Take Profit @ 15.9500
- Stop Loss @ 15.6000
- Upside Potential: 2,000 pips
- Downside Risk: 1,500 pips
- Risk/Reward Ratio: 1.33

