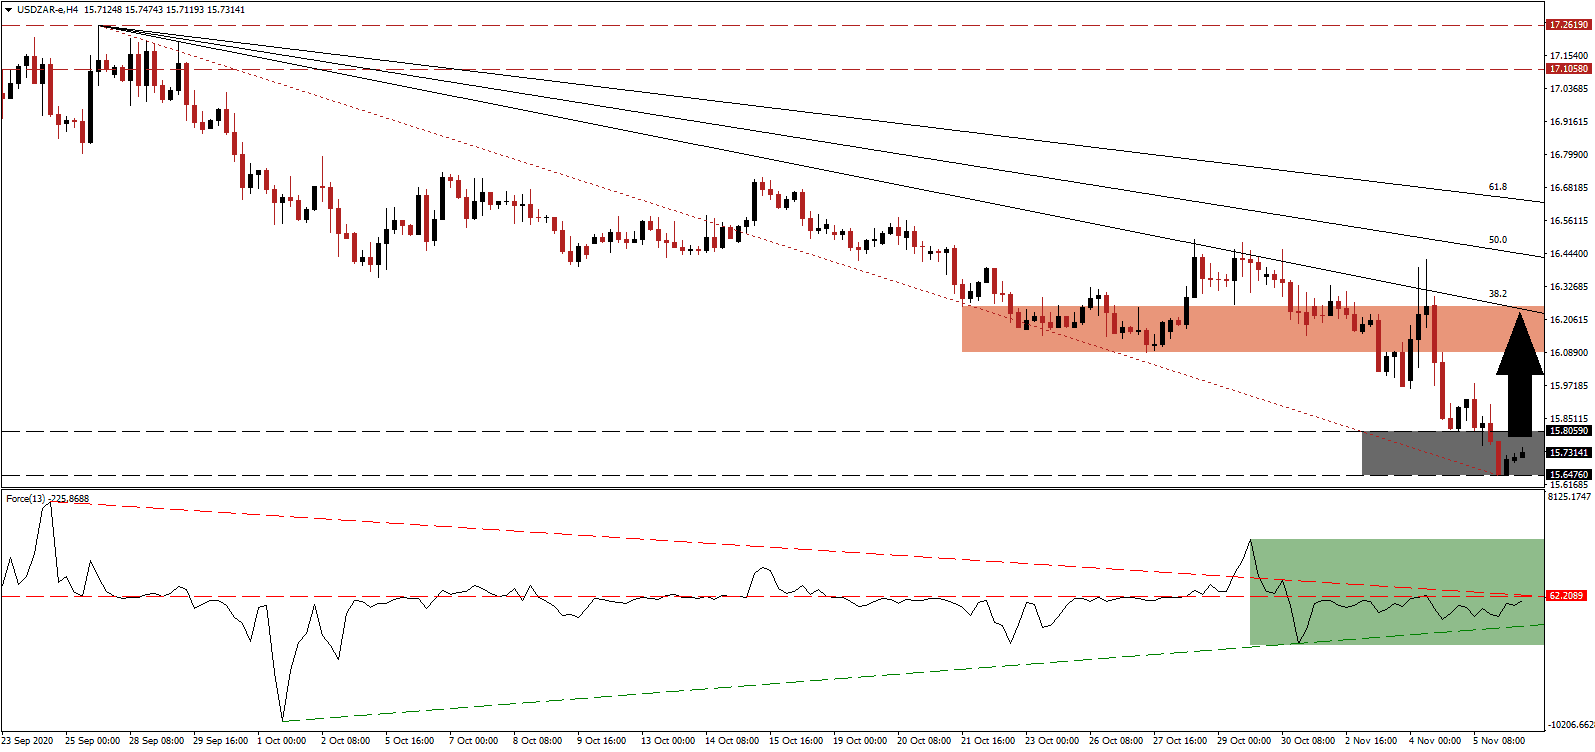
Due to the surge in Covid-19 infection across Europe, South Africa continues to decline in the global ranking of most-infected countries, presently at number thirteen, which is not a sign of improving conditions. It remains the most severely impacted economy on the African continent, and the lack of testing distorts the complete image. The second wave of the pandemic starts to become visible despite it, posing a significant challenge to President Cyril Ramaphosa. US Dollar weakness pressured the USD/ZAR into its support zone from where a short-covering rally is likely to precede more downside.
The Force Index, a next-generation technical indicator, started to advance while price action drifted lower, forming a positive divergence. Magnifying bullish momentum is the ascending support level, on course, to pressure for a move above the horizontal resistance level, as marked by the green rectangle, which will also result in a breakout above the descending resistance level. Bulls increase their control over the USD/ZAR with this technical indicator on the verge of crossing above the 0 center-line.
With many economies embracing digitalization and executing it successfully, South Africa lags visibly in this category. Per the International Telecommunications Union's Information Society Index, the country continues to slide in the rankings. An inadequate digital infrastructure requires a significant investment for the economy to adopt a modern system. Selling pressure in the USD/ZAR temporarily receded inside of its support zone located between 15.6476 and 15.8059, as identified by the grey rectangle, with a breakout pending.
Offshore investing gains popularity across South Africa, partially spurred by depressing local conditions. The 2020 Bloomberg Misery Index ranks South Africa as the third most miserable country globally. Socio-economic inequalities remain one of the biggest obstacles for the government to tackle. The USD/ZAR is ripe for a brief rally into its short-term resistance zone located between 16.0881 and 16.2529, as marked by the red rectangle. The descending 38.2 Fibonacci Retracement Fan Resistance Level maintains the long-term bearish trend.
USD/ZAR Technical Trading Set-Up - Short-Covering Scenario
- Long Entry @ 15.7350
- Take Profit @ 16.2150
- Stop Loss @ 15.5500
- Upside Potential: 4,800 pips
- Downside Risk: 1,850 pips
- Risk/Reward Ratio: 2.60
A breakdown in the Force Index below its ascending support level will bypass any short-term advance and place the USD/ZAR on track for more downside. Ongoing US Dollar weakness is the primary catalyst for more downside pressure, and Forex traders should take advantage of any advance with new short positions. A breakdown resumption can take price action into its next support zone between 15.0276 and 15.2053.
USD/ZAR Technical Trading Set-Up - Breakdown Resumption Scenario
- Short Entry @ 15.4500
- Take Profit @ 15.0300
- Stop Loss @ 15.5500
- Downside Potential: 4,200 pips
- Upside Risk: 1,000 pips
- Risk/Reward Ratio: 4.20

