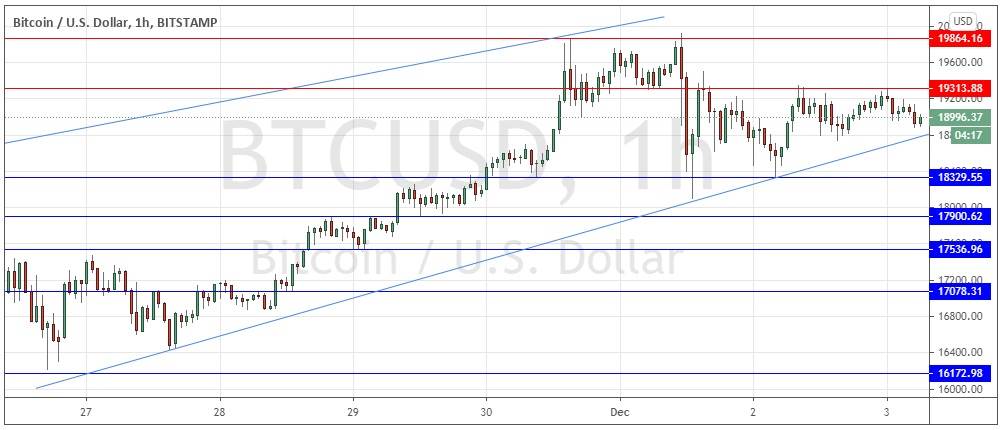
Yesterday’s signals produced a short trade entry from the bullish reversal at the resistance level identified at $19,314. Price action has been indecisive, keeping this trade open.
Today’s BTC/USD Signals
Risk 0.50% per trade.
Trades must be taken before 5pm Tokyo time Friday.
Long Trade Ideas
Long entry after a bullish price action reversal on the H1 time frame following the next touch of $18,330, $17,900, or $17,537.
Put the stop loss $50 below the local swing low.
Adjust the stop loss to break even once the trade is $50 in profit by price.
Remove 50% of the position as profit when the trade is $50 in profit by price and leave the remainder of the position to ride.
Short Trade Ideas
Short entry after a bearish price action reversal on the H1 time frame following the next touch of $19,314, $19,864 or $20,000.
Put the stop loss $50 above the local swing high.
Adjust the stop loss to break even once the trade is $50 in profit by price.
Remove 50% of the position as profit when the trade is $50 in profit by price and leave the remainder of the position to ride.
The best method to identify a classic “price action reversal” is for an hourly candle to close, such as a pin bar, a doji, an outside or even just an engulfing candle with a higher close. You can exploit these levels or zones by watching the price action that occurs at the given levels.
BTC/USD Analysis
I wrote yesterday that due to the less bullish price action, it was best to stand aside and wait for the price to get established above $20,000 before entering any new long trades, although committed trend traders may wish to look for a long entry following a pullback to $18,330 and a bullish bounce there if it sets up again.
I said that the evidence of how the price is reacting when it makes new all-time highs and its failure to hit $20,000 send a message that we may be about to see a major bearish reversal and long-term double top just below $20,000.
This was a good call, as despite all the bullish hype over Bitcoin still running wild yesterday, the price failed to make a new high and so far has acted bearishly at the new lower resistance level I identified at $19,314, so my bearish caution was justified.
The technical picture is a little more bearish today, with $19,314 continuing to hold so far and the price is now threatening to break below the bearish trend line shown within the price chart below – if it happens today, this will be a bearish sign.
This area near $20,000 remains very pivotal for Bitcoin. I think if the price does close above $20,000 at the end of today it will be worth trying to take a long trade to exploit the breakout as the price could rise much higher quickly. On the other hand, a major bearish reversal from a double top could already be upon us, so long- to medium-term short trades from either of the nearby resistance levels of the round number at $20,000 could also be good bets.
Bitcoin is in a pivotal price area and is worth monitoring closely.
Regarding the USD, there will be a release of Unemployment Claims data at 1:30pm London time followed by ISM Services PMI numbers at 3pm.


