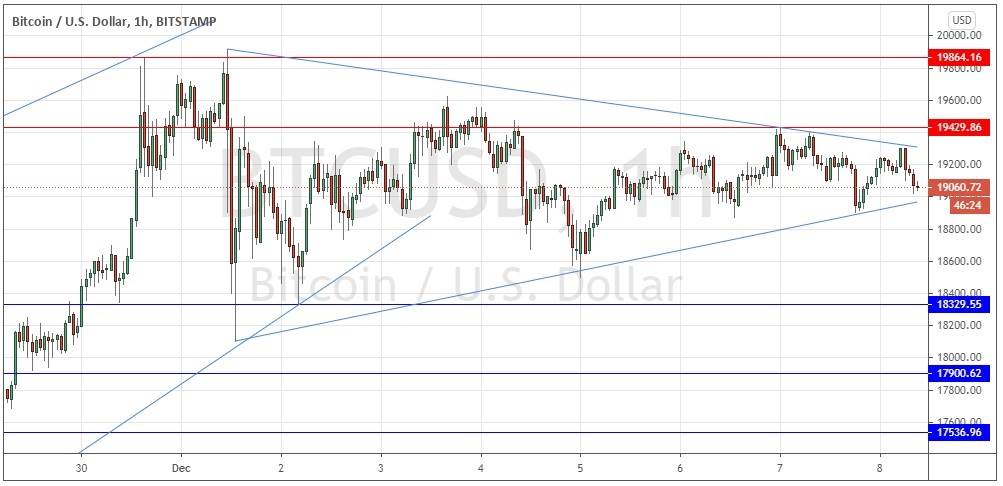
Yesterday’s signals may have produced a profitable short trade entry from the bearish rejection of the resistance level I identified yesterday at $19,429.
Today’s BTC/USD Signals
Risk 0.50% per trade.
Trades must be taken before 5pm Tokyo time Wednesday.
Long Trade Ideas
Long entry after a bullish price action reversal on the H1 time frame following the next touch of $18,330, $17,900, or $17,537.
Put the stop loss $50 below the local swing low.
Adjust the stop loss to break even once the trade is $50 in profit by price.
Remove 50% of the position as profit when the trade is $50 in profit by price and leave the remainder of the position to ride.
Short Trade Ideas
Short entry after a bearish price action reversal on the H1 time frame following the next touch of $19,429, $19,864 or $20,000.
Put the stop loss $50 above the local swing high.
Adjust the stop loss to break even once the trade is $50 in profit by price.
Remove 50% of the position as profit when the trade is $50 in profit by price and leave the remainder of the position to ride.
The best method to identify a classic “price action reversal” is for an hourly candle to close, such as a pin bar, a doji, an outside or even just an engulfing candle with a higher close. You can exploit these levels or zones by watching the price action that occurs at the given levels.
BTC/USD Analysis
I wrote yesterday that the technical picture was showing indecision just below the nearby resistance level at $19,430. I thought it was worth keeping a close eye on Bitcoin at the moment at it seems to be located within a pivotal area just below $20,000 near the all-time high price it made last week, but that it is important not to rush into a trade and get faked out, especially on the long side.
This analysis is bearing up well as the price remains indecisive, just ranging below the resistance level at $19,430 which held again almost to the dollar yesterday. The price chart below shows we can connect both the recent highs and lows with trend lines which forms a narrowing, consolidating triangle pattern, which highlights the current indecision.
I again recommend to consider entering a long trade only after the price makes a New York close above the huge round number and all-time high at $20,000 and not to enter any new long trade until that happens, for the time being.
A short trade could become more attractive, as it could be that Bitcoin has already hit a new long or medium-term high price that will not be exceeded for a while. An initial sign that a downwards movement has become more likely to happen soon is the fact that the resistance at $19,430 has held. This would be confirmed technically by a break below the lower ascending trend line shown in the price chart below which is currently sitting at about $18,971. To be on the safe side, due to recent slightly lower swing lows which acted as bullish infection points, I would wait to go short until the price has made two consecutive hourly closes below $18,871 and is moving with firm bearish momentum on short time frames.
 There is nothing of high importance due today regarding the USD.

