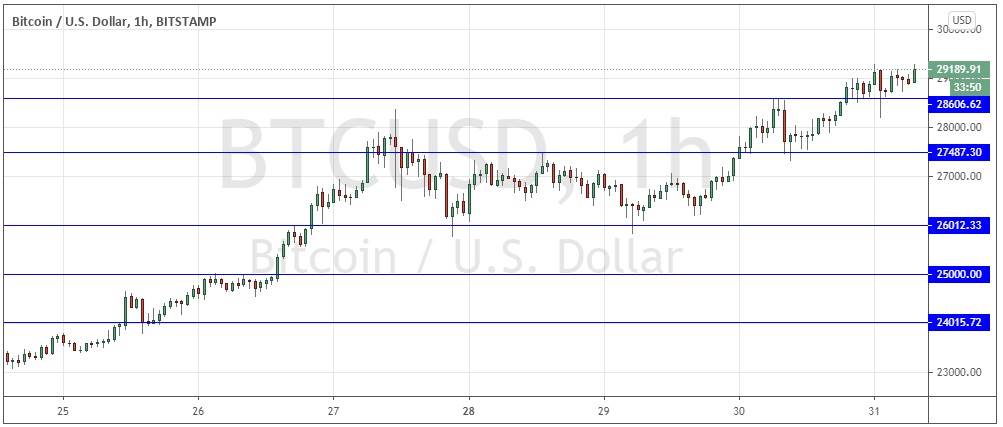
Yesterday’s signals produced a nicely profitable long trade from the bullish pin candlestick which rejected the support level identified yesterday at $27,487.
Today’s BTC/USD Signals
Risk 0.50% per trade.
Trades must be taken prior to 5pm Tokyo time Thursday.
Long Trade Ideas
Go long after a bullish price action reversal on the H1 time frame following the next touch of $28,607, $27,487, $26,012, or $25,000.
Place the stop loss $100 below the local swing low.
Move the stop loss to break even once the trade is $100 in profit by price.
Take off 50% of the position as profit when the trade is $100 in profit by price and leave the remainder of the position to run.
Short Trade Idea
Go short after a bearish price action reversal on the H1 time frame following the next touch of $30,000.
Place the stop loss $100 above the local swing high.
Move the stop loss to break even once the trade is $100 in profit by price.
Take off 50% of the position as profit when the trade is $100 in profit by price and leave the remainder of the position to run.
The best method to identify a classic “price action reversal” is for an hourly candle to close, such as a pin bar, a doji, an outside or even just an engulfing candle with a higher close. You can exploit these levels or zones by watching the price action that occurs at the given levels.
BTC/USD Analysis
I wrote yesterday that with the price hitting new all-time highs, these factors give every reason to be bullish on Bitcoin, while being aware that the rise cannot last forever and that volatility is very high, so trade position sizing here should be small and tight hard stop losses should be used when trading or even investing in Bitcoin.
I thought that the rise looked likely to continue to $30k and there might be some resistance there due to profit-taking at this round number.
My bullish bias yesterday on Bitcoin was a good call as was the rest of my analysis, with the price rising strongly for another day to trade at a new all-time high above $29,000. We have seen the price increase by another 5% or so over the last 24 hours which has been a typical recent daily price movement, so everything seems normal.
There is no change at all to the very bullish technical picture with the strong bullish rally into new all-time high prices showing every sign of continuing, although there might be year-end profit taking later. We may also see this happen at or near the big round number at $30,000, so short-term traders taking long trades should watch out for that.
I will be happy to make another long trade entry if we get a retracement to the new higher support level at $28,607 and a bullish bounce there. The printing of that new higher support level is a further bullish sign.
There is nothing of high importance scheduled today concerning the USD.

