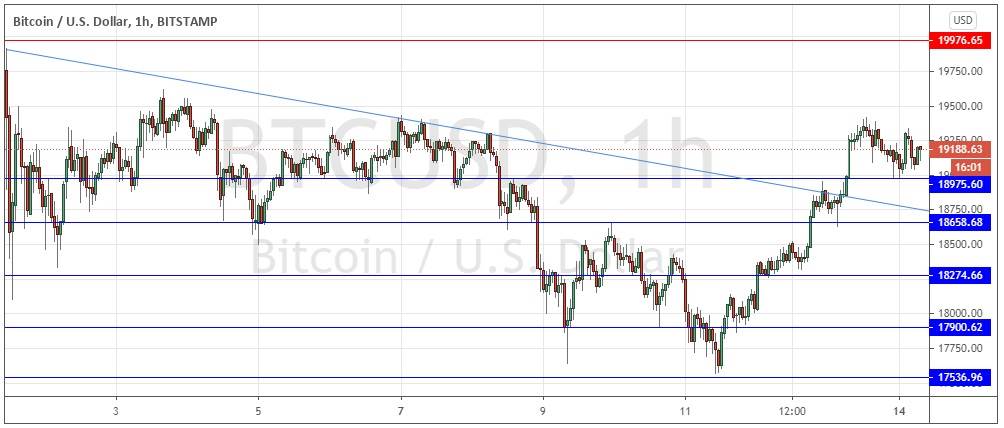
Last Thursday’s signals were not triggered as the bullish price action took place below the support level identified at $17,900 but above the level at $17,537.
Today’s BTC/USD Signals
Risk 0.50% per trade.
Trades must be taken before 5pm Tokyo time Tuesday.
Long Trade Ideas
Long entry after a bullish price action reversal on the H1 time frame following the next touch of $18,976, $18,659, or $18,275.
Place the stop loss $50 below the local swing low.
Move the stop loss to break even once the trade is $50 in profit by price.
Take off 50% of the position as profit when the trade is $50 in profit by price and leave the remainder of the position to run.
Short Trade Ideas
Short entry after a bearish price action reversal on the H1 time frame following the next touch of $19,977 or $20,000.
Place the stop loss $50 above the local swing high.
Move the stop loss to break even once the trade is $50 in profit by price.
Take off 50% of the position as profit when the trade is $50 in profit by price and leave the remainder of the position to run.
The best method to identify a classic “price action reversal” is for an hourly candle to close, such as a pin bar, a doji, an outside or even just an engulfing candle with a higher close. You can exploit these levels or zones by watching the price action that occurs at the given levels.
BTC/USD Analysis
I wrote last Thursday that the technical picture seemed to be becoming more bearish still as a bearish price channel emerged in the price chart. This convinced me that we were likely to see mostly downwards movement over the rest of 2020, with the price unlikely to reach $20,000 any time soon.
My forecast was correct over the short term, as the price moved down over the 24 hours immediately following my forecast. However, since Friday, the price has made a relatively strong bullish move, breaking the descending trend line shown in the price chart and returning the price to the area near the recent all-time high which was made a little way below $20,000.
This has created a more bullish technical picture, so I have to say that another test of the all-time high is quite possible any day now, even today. The key thing to watch for in order to measure how well the bulls are doing will be whether the price can remain above the support level at $18,659 if tested, as this level is quite confluent with the broken bearish trend line which the bulls will want to turn into support. If the price reacts bullishly at a test of the higher support level at $18,976 that would be an even more bullish scenario.
Despite the more bullish picture, I prefer to wait for a New York daily close above $20,000 before entering any new long trades for the time being.
 There is nothing of high importance due today concerning the USD.
