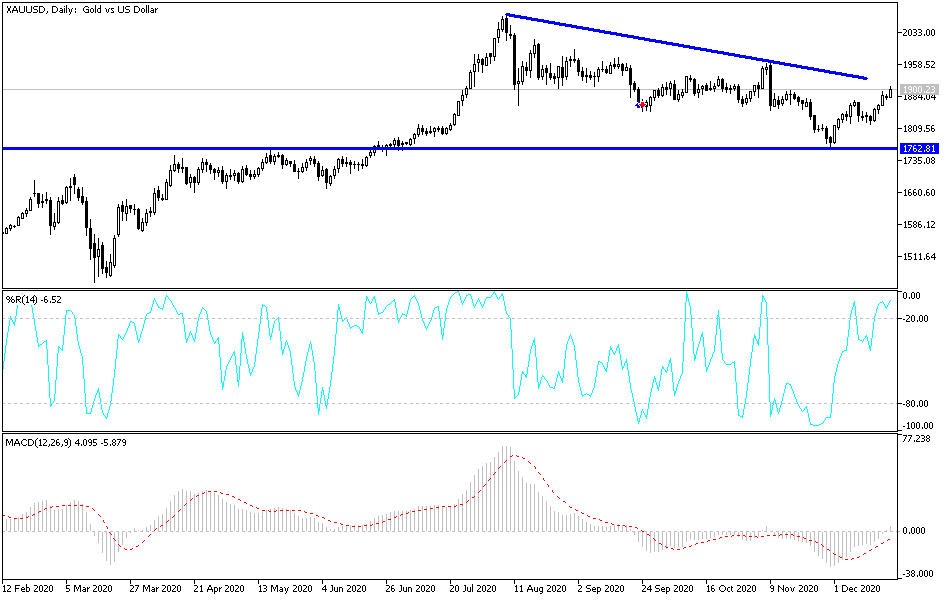
Investors are returning to risk aversion amid new global restrictions to contain the coronavirus outbreak and the emergence of more widespread strains of the disease in conjunction with the annual holiday season. The return of anxiety, along with the dollar’s decline, contributed to pushing the gold price to the $1907 resistance, its highest level in a month-and-a-half. There is no doubt that the stability of the yellow metal price above the resistance will relaunch the increase in purchases, and we do not rule out further gains, especially if the new strains of the COVID-19 pandemic reject vaccines. Recently, gold trading has been interacting with the increasing optimism of global financial markets amid positive developments regarding the COVID-19 vaccine. However, recent US economic data provided mixed results, which boosted gold's gains.
A growing list of European Union countries and Canada have banned travel from the UK, with others considering similar action, in an effort to prevent a new strain of the coronavirus from sweeping through southern England and spreading to the continent. Accordingly, France, Germany, Italy, the Netherlands, Belgium, Austria, Ireland and Bulgaria announced travel restrictions to the United Kingdom, hours after British Prime Minister Boris Johnson announced that Christmas shopping and gatherings in southern England should be cancelled due to the rapid spread of the infection that is blamed on a new coronavirus variant.
Johnson immediately put those areas under a new strict Tier 4 restriction level, changing Christmas plans for millions.
France banned all flights from the UK for 48 hours from midnight Sunday, including trucks carrying goods through the tunnel under the English Channel or from the Port of Dover on the south coast of England. French officials also said the stop would save time to find a "common doctrine" on how to deal with the threat, but it turned the busy road into a mess.
Technical analysis of gold:
In the near term, and according to the performance on the hourly chart, it appears that the price of gold is trading within an upward curve. It also appears that the yellow metal has recently completed a bullish breach of the descending channel formation. The recent pullback on Friday prevented it from climbing to the overbought levels of the 14-hour RSI. Accordingly, bulls will look to extend the current short-term uptrend towards $1920 or higher to $1961. On the other hand, bears will target short-term downturn gains around $1841 or less to $1804.
In the long term, and according to the performance on the daily chart, it appears that the price of gold is trading within a descending channel. This indicates a significant long-term bearish bias in market sentiment. It recently bounced off the oversold levels in the 14-day RSI. Accordingly, bulls will be looking to ride the current bounce by targeting profits at around $1992 or higher at $2,140. Bears will target long-term gains at around 50% and 76.40% Fibonacci at $1,769 and $1610, respectively.
Today's gold price is not expecting any important and influential economic data, and it will move with the extent of investor’s risk appetite.


