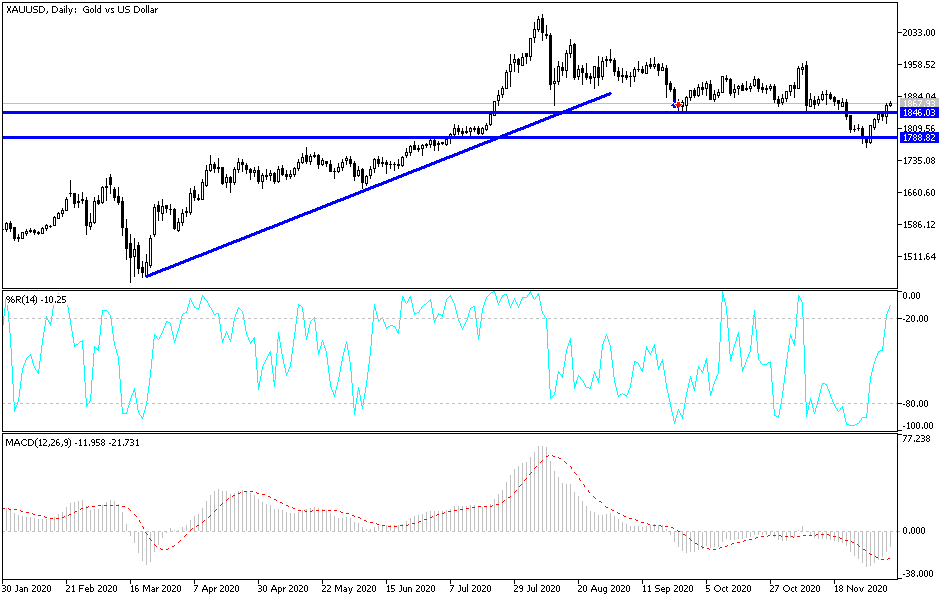
The attention of gold investors returned to the psychological resistance at $1900 an ounce, after recent gains in the price of gold pushed it to the $1868 level at the beginning of this week's trading. Gold is taking advantage of the continued decline of the US dollar and the increase in anxiety in global financial markets, which is a fertile environment for the yellow metal to achieve gains. Gold prices continued to achieve more gains after falling to its lowest level in 5 months last week. This was largely due to the weakening of the US dollar and the weak US non-farm payroll numbers which increased expectations for further economic stimulus.
The US Dollar Index showed a stronger negative correlation with gold prices as the index fell to the 90.66 level, its lowest level in two-and-a-half years . Despite the disengagement from September until early this month, recent developments of coronavirus vaccines have not yet given the US dollar the support it needs. Instead, investors appear to believe that a deteriorating US labour market and rapidly increasing COVID-19 cases could allow the Fed to maintain this still favourable monetary environment and demand additional financial support. This assumption is largely in favour of gold prices.
The price of gold rose again with the escalation of tensions between the United States and China and the continuing state of uncertainty over a Brexit trade agreement. Tensions between the two largest economies in the world are escalating, as Reuters reported that the United States is preparing to impose sanctions on at least ten Chinese officials due to their alleged role in Beijing disqualifying Hong Kong's elected opponents.
In return, investors began pricing in the possibility of a "no-deal" outcome of trade negotiations between the European Union and the United Kingdom after The Sun reported that Prime Minister Boris Johnson was willing to walk away from the negotiations "within hours" amid stubborn disputes over fishing rights in the UK waters, fair competition and ways to resolve future disputes. Johnson was said to demand a time limit for the Brexit deal if Brussels refused to back down on its "nefarious" demands.
This week, the European Central Bank is expected to announce more bond purchases. In the United States, weak US jobs data released last week helped raise expectations for a new fiscal stimulus package to be passed before the end of 2020.
Technical analysis of gold:
Gold prices reached a major resistance point at the 20-day simple moving average. Also, this was the middle line of the Bollinger Bands. A breach of this level may indicate the possibility of a reversal of the trend, and this may be confirmed by testing the psychological resistance at $1900 again. A failed test could lead to harmonic reversal with a close focus on support at $1750 an ounce for further support. Therefore, it appears that the main trend is biased towards the downside, as evidenced by the consecutive lower lows and lower highs. Basically, the MACD appears to have formed a golden crossover across the MACD trend lines that remain in negative territory.
In the latest technical analyses, I mentioned that buying at every lower level is the best strategy for trading gold. Optimism about coronavirus vaccines will not last long if COVID-19 infections are at a record increase and the global economy suffers. The closest buying levels are 1829, 1800 and 1785, respectively.


