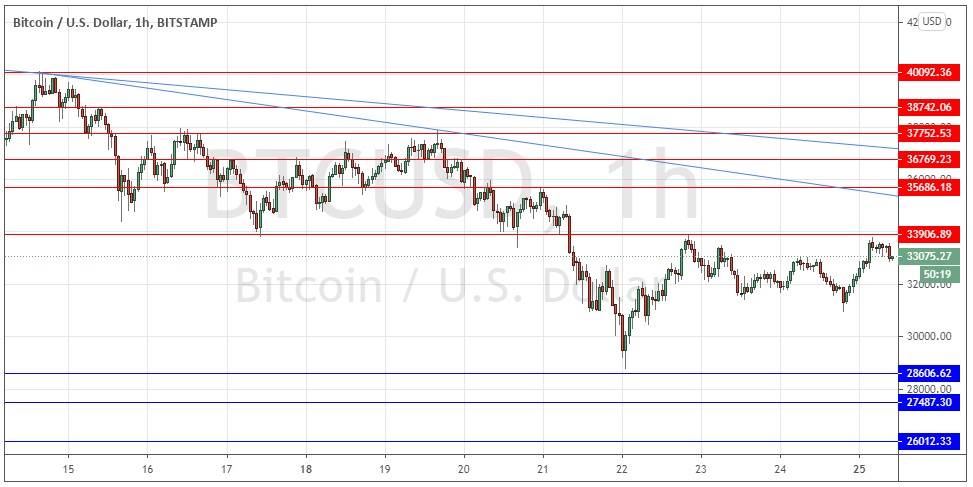
Last Wednesday’s signals were not triggered, as there was no bullish price action when the support level identified at $33,990 was first reached that day.
Today’s BTC/USD Signals
Risk 0.50% per trade.
Trades may only be entered before 5pm Tokyo time Tuesday.
Long Trade Ideas
Long entry after a bullish price action reversal on the H1 time frame following the next touch of $28,607.
Put the stop loss $100 below the local swing low.
Adjust the stop loss to break even once the trade is $100 in profit by price.
Remove 50% of the position as profit when the trade is $100 in profit by price and leave the remainder of the position to ride.
Short Trade Ideas
Short entry after a bearish price action reversal on the H1 time frame following the next touch of $33,907, $35,686, or $36,769.
Put the stop loss $100 above the local swing high.
Adjust the stop loss to break even once the trade is $100 in profit by price.
Remove 50% of the position as profit when the trade is $100 in profit by price and leave the remainder of the position to ride.
The best method to identify a classic “price action reversal” is for an hourly candle to close, such as a pin bar, a doji, an outside or even just an engulfing candle with a higher close. You can exploit these levels or zones by watching the price action that occurs at the given levels.
BTC/USD Analysis
I wrote last Wednesday that the price seemed to be stuck between $37,753 where there was a bearish double top, and the $35,000 area where we saw a bullish head and shoulders and double bottom.
I thought that this consolidation pattern was highly likely to continue over the short to medium term.
My forecast and key levels were enough to keep out of trouble, but I was basically wrong, as the price managed to get much lower than I had expected that same day.
The technical picture has clearly become more bearish, with the new medium-term bearish trend lines drawn connecting the price. We also cannot draw any key support levels above $30K, although that price area was very supportive when it was reached last Wednesday. If you zoom out to check the daily chart, this $30k area looks extremely pivotal. If the price gets established below it, we are quite likely to see a further move down to the $20k area.
On the other hand, looking above, there is a very pivotal resistance level at $33,907, which looks very interesting as a level for a bearish reversal triggering a potential short trade entry.
I will be happy to take a short trade today from $33,907 if a reversal sets up there, and I will still consider a long trade from $28,607.
If $33,907 continues to hold, the outlook remains bearish.
There is nothing of high importance due today concerning the USD.

