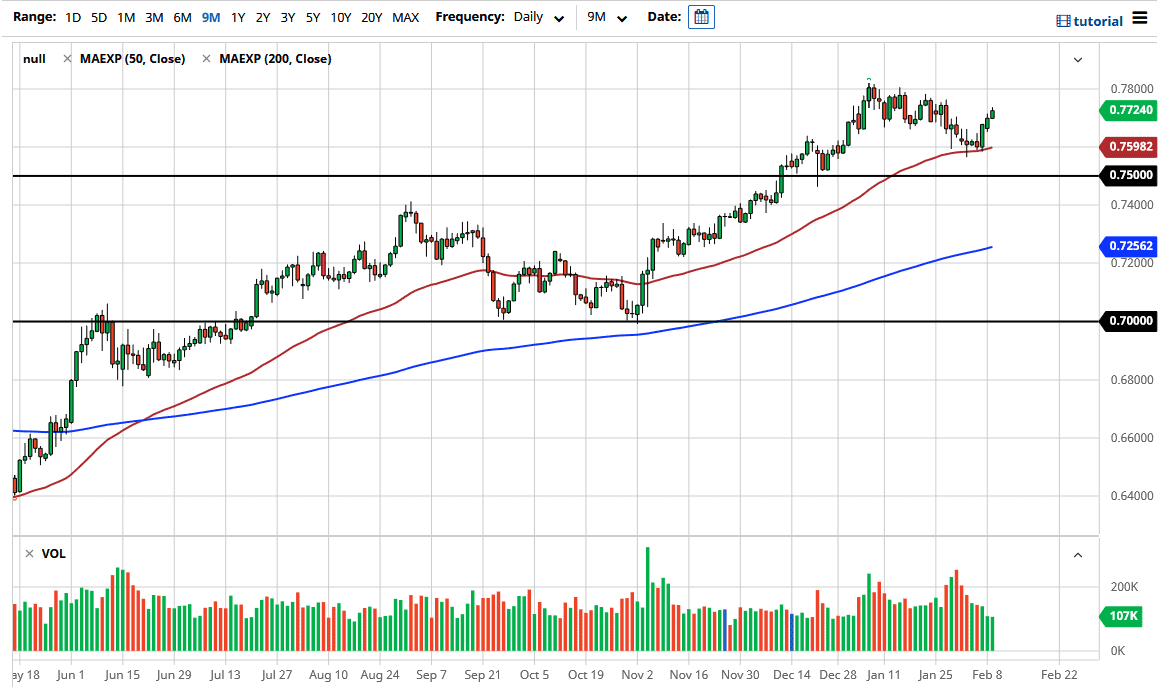
The Aussie dollar continues to show strength as it bounced from the 50-day EMA recently, which will capture the attention of a lot of traders. After all, the market tends to pay close attention to the 50-day EMA over the longer term, and you can see that it lines up quite nicely with the 0.76 level before bouncing. Now that we have had three candlesticks in a row to the upside, it looks like the overall uptrend is ready to continue. However, there is still a significant amount of resistance above, so what I am looking for is a short-term pullback that I can take advantage of.
To the downside, I believe that there is support all the way down to the 0.75 handle, so it is not until we break down below there that I will begin to worry about the Aussie. The Aussie is highly levered to commodities and the entire “reflation trade” that everybody is involved in. The idea that stimulus in the United States is going to be massive suggests that the commodities markets will get a massive boom, not only due to US dollar devaluation, but the idea that there will be enormous demand for copper, aluminum and gold, along with several other hard commodities.
The Australian economy is also highly levered to China, which is worth paying attention to as well. The Chinese economy has a certain amount of strength built into it due to the fact that it is the world’s factory, so if there is a global return to normalcy coming, then it makes sense that there would be massive demand coming from the mainland for Australian goods such as raw materials. As a general rule, when you see three candlesticks like this you will get some type of pullback, but that also suggests that you will go higher over the longer term. After all, I do not expect that the market is suddenly going to slice through the 0.78 handle without any concern, but I do think that we are trying to build up the necessary momentum to finally make that happen. If we can break above the 0.78 handle, then we will threaten the 0.80 level above, which is a massive level on the monthly chart.


