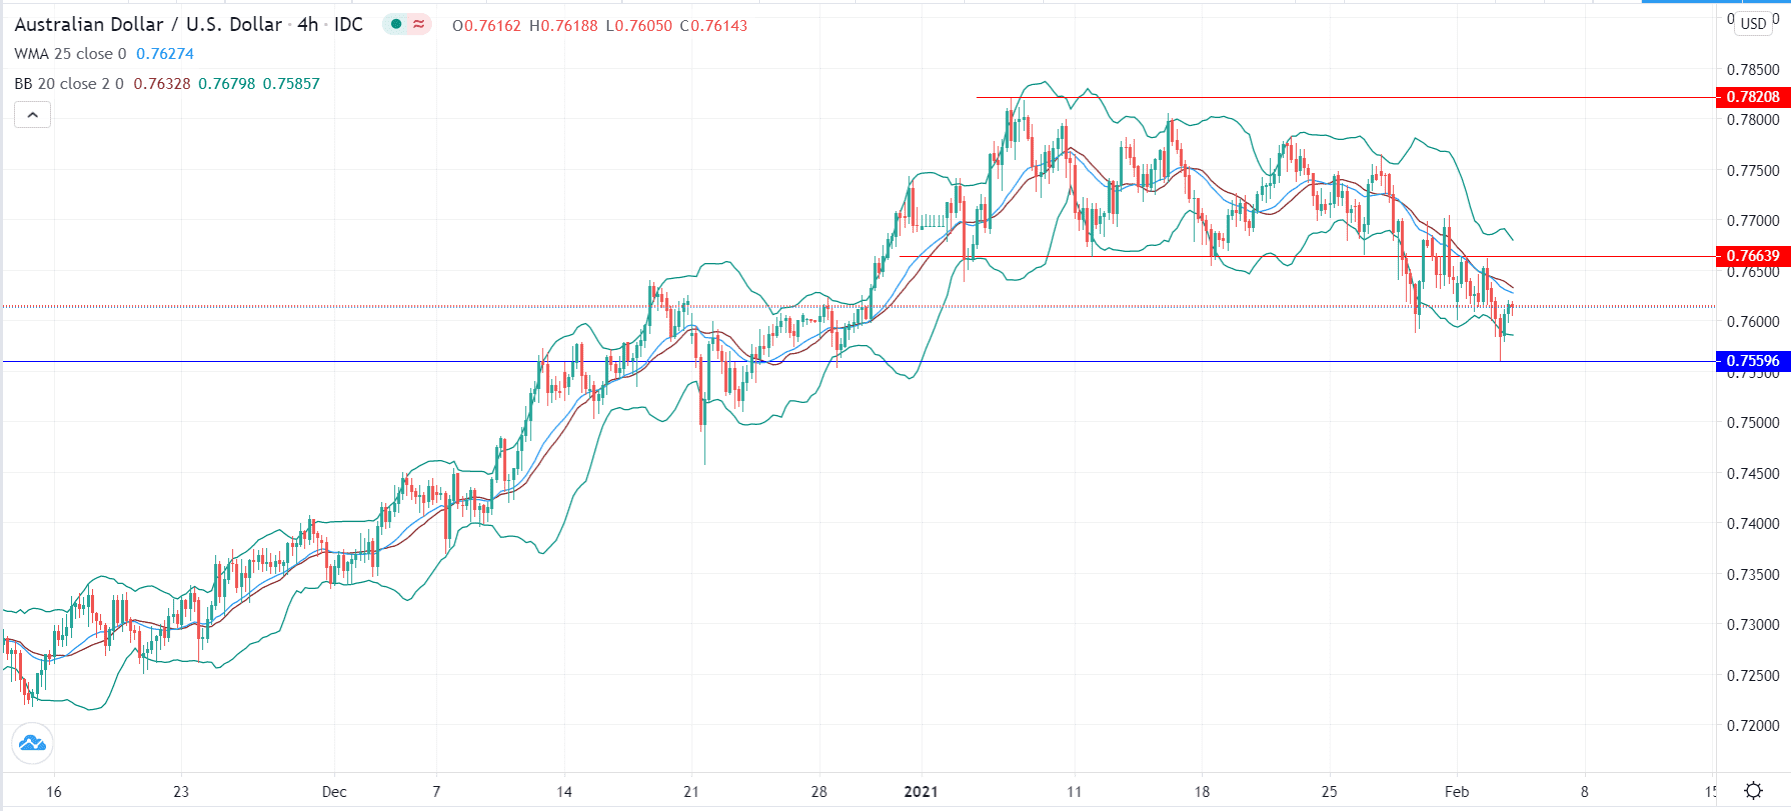
Bullish signal
Set a buy stop at 0.7640 (middle Bollinger Band).
Add a stop loss at 0.7560 (lower level of hammer pattern).
Set a take-profit at 0.7682 (upper Bollinger Band).
Bearish signal
Set a sell-stop at 0.7560 and a take-profit at 0.7500.
Add a stop-loss at 0.7650.
The AUD/USD has bounced back from yesterday’s low of 0.7560 to 0.7615 after the relatively strong Australian economic data.
Australian Economy Steady
On Monday, data from Australia and China showed that the manufacturing sectors were relatively strong in January. Today, according to Markit, the Service PMI declined from 57.0 in December to 55.6 in the previous month. This happened as more service providers like restaurants continued to reopen. In China, the Service PMI declined from 56.3 to 52.0 because of the lockdowns imposed in Hebei province.
Further data from Australia showed that building approvals rose by 15.8% in December from 6.1% in the previous month, while the Construction Index rose to 57.6.
These numbers came a day after the Reserve Bank of Australia (RBA) delivered its first interest rate decision of the year. In it, the bank decided to leave interest rates unchanged at 0.10% and boost its quantitative easing program by about A$100 billion. It also left its term lending facility for businesses and households intact. The decision implied that the central bank will possibly not move to negative interest rates as some analysts were expecting.
Looking ahead, the AUD/USD will next react to US employment numbers that will come out today, tomorrow, and on Friday. Today, the ADP will publish its estimate for US private payrolls. On Thursday and Friday, the Labour Department will release the jobless claims and non-farm payroll numbers. Further, the AUD/USD will react to Australia’s retail sales and trade numbers.
AUD/USD Technical Analysis
In January, the AUD/USD was in a channel between 0.7820 and 0.7663. It broke-out below this channel on January 27 and fell to 0.7590. It then returned to the channel and then quickly dropped to 0.7560. On the four-hour chart, the pair is below the 15-day moving average and between the lower and middle lines of the Bollinger Bands.
The pair has also formed a hammer pattern, which means that bulls could push it to the 0.7650 resistance level. However, a drop below 0.7560 will mean that bears are still in control. This could see it drop to 0.7500.

