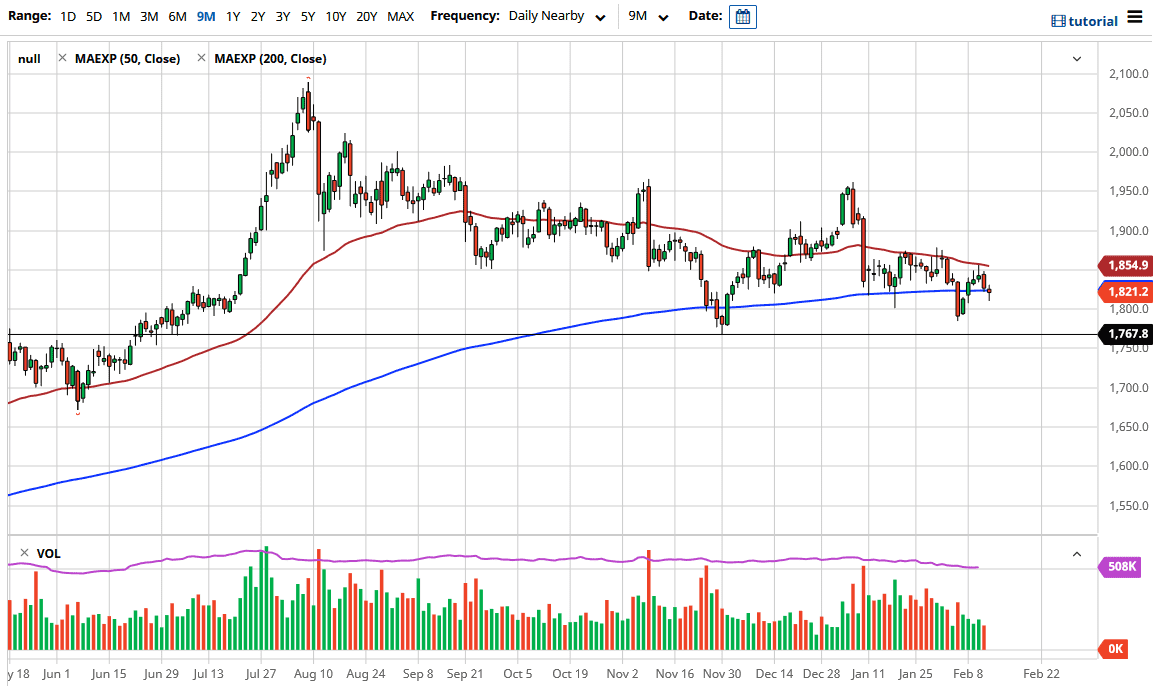
The gold markets fell during the trading session on Friday, dipping down below the 200-day EMA. However, we have turned around to form a bit of a hammer, which is a bullish sign. Nonetheless, we have a market that seems to be all over the place, so I think you need to pay attention to multiple things at the same time.
The gold market showing support underneath could push his market to the upside, as buyers have come back into this market multiple times just below. Furthermore, the $1800 level is an area that attracts a lot of attention, and I believe there is support all the way from there down to the $1750 handle. If we break down below that area, we could see this market collapse for several hundred dollars. The gold markets are moving based upon what is going on in the interest rate markets right now, with the 10-year note being particularly interesting. As the interest rates in the United States have been climbing, it makes gold a little less attractive due to the fact that you can earn yield by holding paper, instead of storing physical gold.
We have formed a hammer sitting at the 200-day EMA, so if we break above the top of the candlestick, then it is likely that we could go looking towards the 50-day EMA. The 50-day EMA is closer to the $1854 level, and if we can break above that, it is likely that we could go to the upside, perhaps reaching towards the $1900 level, possibly even as high as $1960. It is easier to look at this as a market that is trying to build up some type of basing pattern, so I like the idea of short-term back-and-forth trading more than anything else. You will probably have to trade on short-term charts more than anything else for the next few weeks. However, if we break either above that 50-day EMA or the $1750 level underneath, then you have a bit of a longer-term signal to be involved with. Until we get some type of clarity, I anticipate that you will have to be very quick in both directions in order to make money here.


