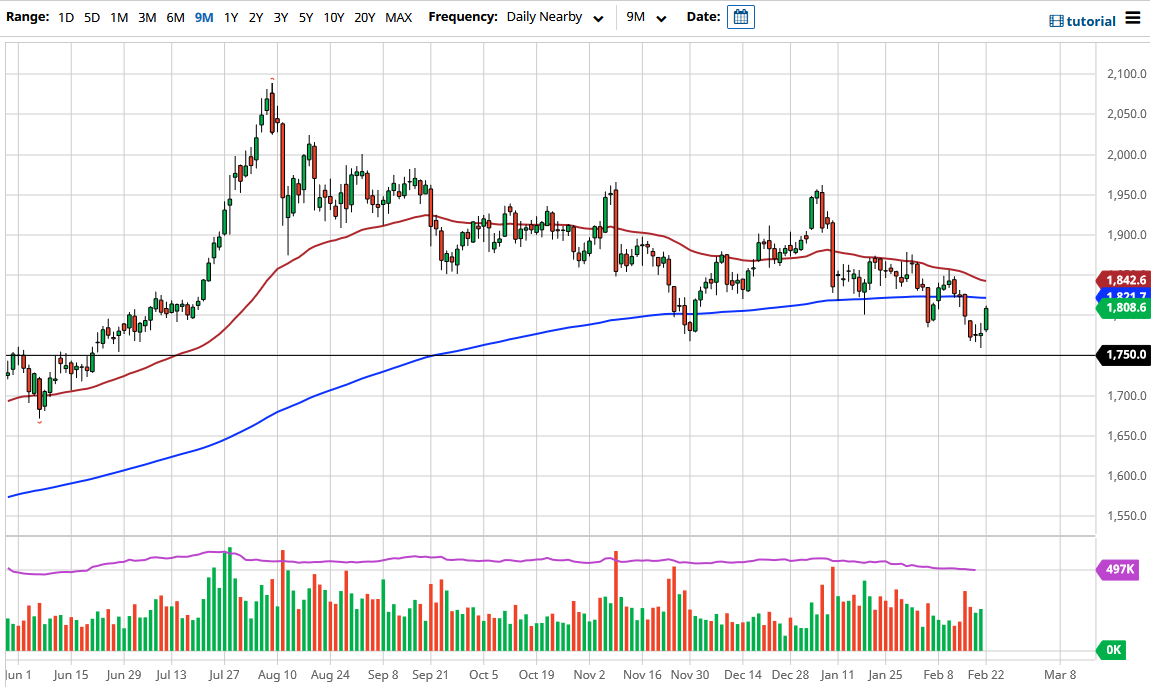
The gold markets gapped higher to kick off the week on Monday, and then shot above the $1800 level. The candlestick is closing towards the top of the range, which is a bullish sign. The 200-day EMA sits just above, so it is likely that we will see a bit of noise there as well. The 200-day EMA has the 50-day EMA sitting just above it and starting to turn lower. The “death cross” is a signal that a lot of traders pay attention to, but I think the moving averages are too flat for them to be something that is going to be overwhelming.
Gold markets have had a bit of a rough ride as of late, as the 10-year note has produced higher interest rates and therefore it takes some of the luster off the gold market. During the Monday session, the 10-year note yields dropped, and that is part of what we are seeing on this chart. After all, it is much cheaper to simply click the coupon and get paid for holding paper then it is to pay for storage of gold.
From a technical point of view, if we were to see the gold market break down below the $1750 level, then it could open up the “trapdoor” for much lower pricing. At that point, the market could very easily drop to the $1500 level, although not in one fell swoop. The market breaking down would almost certainly have to coincide with yields rising, as there has been such a huge negative correlation between the two markets.
To the upside, if we were to break above the 50-day EMA, then it is likely that we will go looking towards the $1950 level. Breaking above there would kick off a bigger uptrend move, but at this point I think it is going to take a Herculean effort to get up there. If you are bullish of this market, you are going to need to do it in very small bits and pieces, because I do think eventually it will become a bullish market. But right now, you have to pay close attention to those yields because they have been such a major influence.


