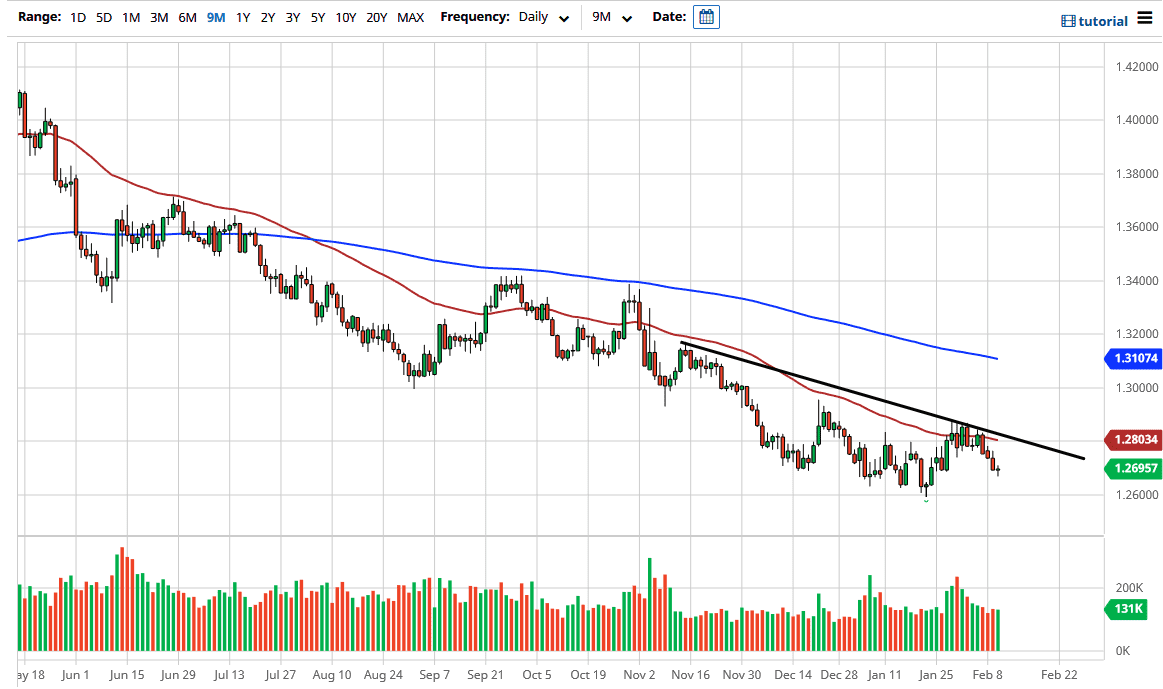
The US dollar went back and forth during the course of the trading session on Wednesday as we hang around the 1.27 level. At this point, the market is likely to continue to hear a lot of noise, but when you look at the chart, you can see that there are multiple negative aspects to this trend. I also would point out that the 1.26 level underneath has been massive support, so we will have to wait and see whether or not it holds. After all, it is a huge support level that extends down to the 1.25 level on the monthly chart, and I think that a lot of people are going to be paying attention down here.
The crude oil markets have been very strong, but they also have gotten ahead of themselves, so I think it does make sense that we would see a bit of a pullback in that market that could send this pair higher, at least in the short term. The 50-day EMA above should offer significant resistance, just as the 1.28 level will and the downtrend line should. This is a market that has been in a downtrend for quite some time, but it is worth noting that there was a massive hammer down at the 1.26 handle, and I think that the market remembers the buying pressure down there. The yields in the United States are starting to rise a bit, and one has to wonder how long it will take before that becomes attractive for Forex traders. That might be a question to ask down the road, but right now it certainly looks as if we are focusing on the idea of stimulus. Nonetheless, you cannot have oil go straight up in the air forever, no matter what the Americans pass as far as stimulus is concerned. If we turn around a break above the downtrend line, that could probably send this market towards the 1.30 level. That would obviously attract a lot of attention from the headline standpoint, but it does make sense on a breakout to test that area, as it is structurally important from a previous support level standpoint. Furthermore, the 200day EMA is likely to go towards that area over the next several days as well.

