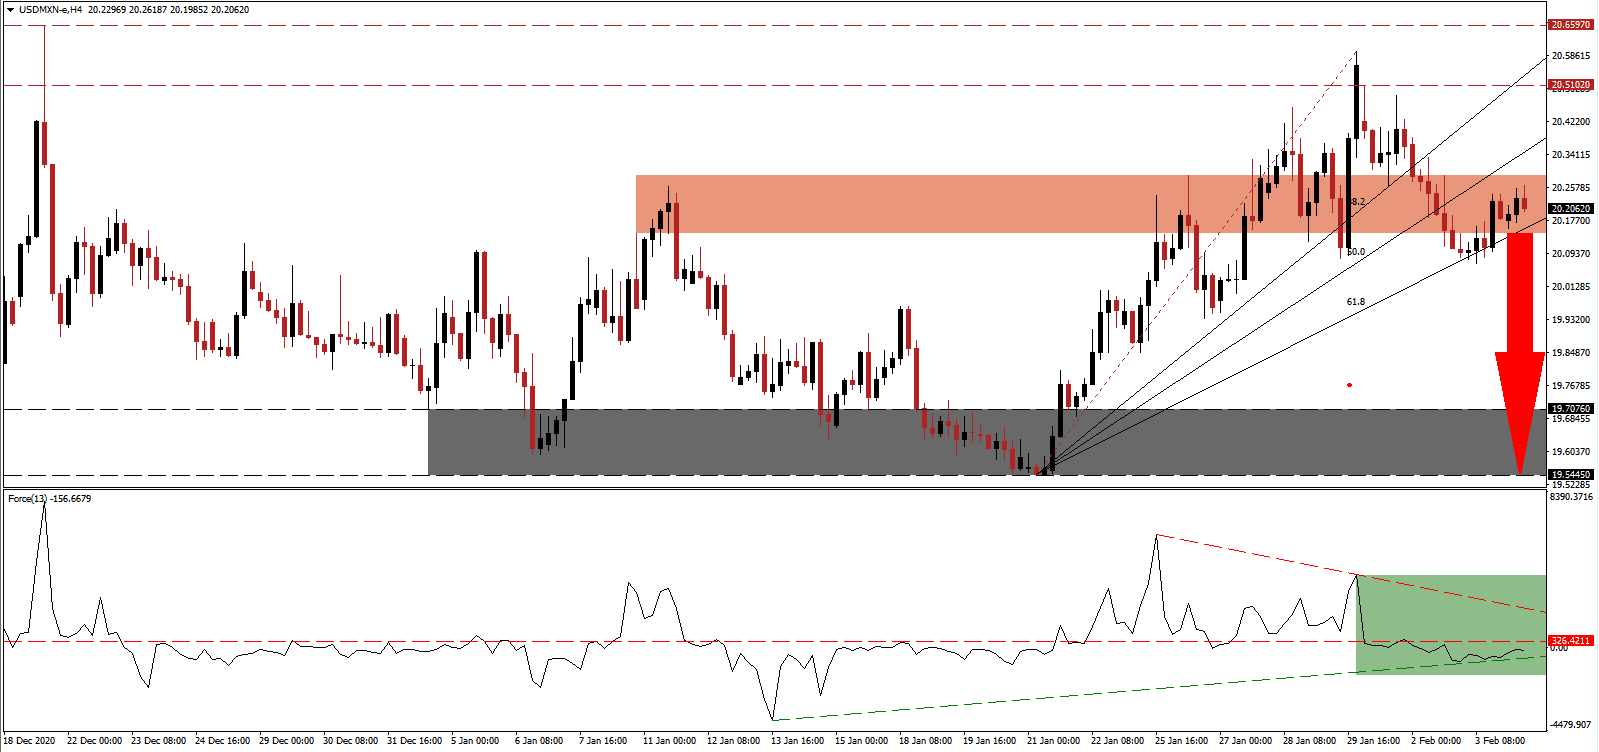
Mexico posted an 8.5% economic contraction in 2020, the worst since 1932, and the second consecutive annualized drop. GDP expanded 3.1% in the fourth quarter of 2020, adding hopes for a 2021 recovery. The USD/MXN faces a correction with a pending breakdown below its short-term resistance zone. It follows the emergence of a head-and-shoulders chart pattern.
The Force Index, a next-generation technical indicator, confirms the dominance of bearish pressures after slipping below its horizontal resistance level. The descending resistance level adds to downside momentum, as marked by the green rectangle, positioning the Force Index for a move below its ascending support level. This technical indicator also moved below the 0 center-line, placing bears in control of the USD/MXN.
Tatiana Clouthier, the Economy Minister of Mexico, announced plans to use tax incentives to spark investment in Mexico. Mexican President López Obrador supports legislation harming it. The USD/MXN nears a breakdown below its ascending 61.8 Fibonacci Retracement Fan Support Level. It crosses through its short-term resistance zone between 20.1451 and 20.2884, as identified by the red rectangle.
A recent survey of private-sector economists conducted by the Banco de México showed an anticipated 2021 GDP expansion of 3.5%. US Treasury Secretary Janet Yellen confirmed that the US views Mexico as a vital partner to tackle economic and environmental challenges. The USD/MXN remains on course for a breakdown into its next horizontal support zone between 19.5445 and 19.7076, as marked by the grey rectangle.
USD/MXN Technical Trading Set-Up - Breakdown Scenario
Short Entry @ 20.2050
Take Profit @ 19.5500
Stop Loss @ 20.3550
Downside Potential: 6,550 pips
Upside Risk: 1,500 pips
Risk/Reward Ratio: 4.37
In case the ascending support level spikes the Force Index higher, the USD/MXN may attempt a brief breakout. Forex traders should consider this a secondary selling opportunity amid a bearish US dollar outlook. The upside potential remains confined to its resistance zone between 20.5102 and 20.6597.
USD/MXN Technical Trading Set-Up - Limited Breakout Scenario
Long Entry @ 20.4550
Take Profit @ 20.6550
Stop Loss @ 20.3550
Upside Potential: 2,000 pips
Downside Risk: 1,000 pips
Risk/Reward Ratio: 2.00


