Bullish View
Set a buy stop at 0.7750 (bullish flag pattern.
Add a take profit at 0.7840 (March high).
Set a stop loss at 0.7700.
Bearish View
Set a sell stop at 0.7700 and a take profit at 0.7650.
Add a stop loss at 0.7750.
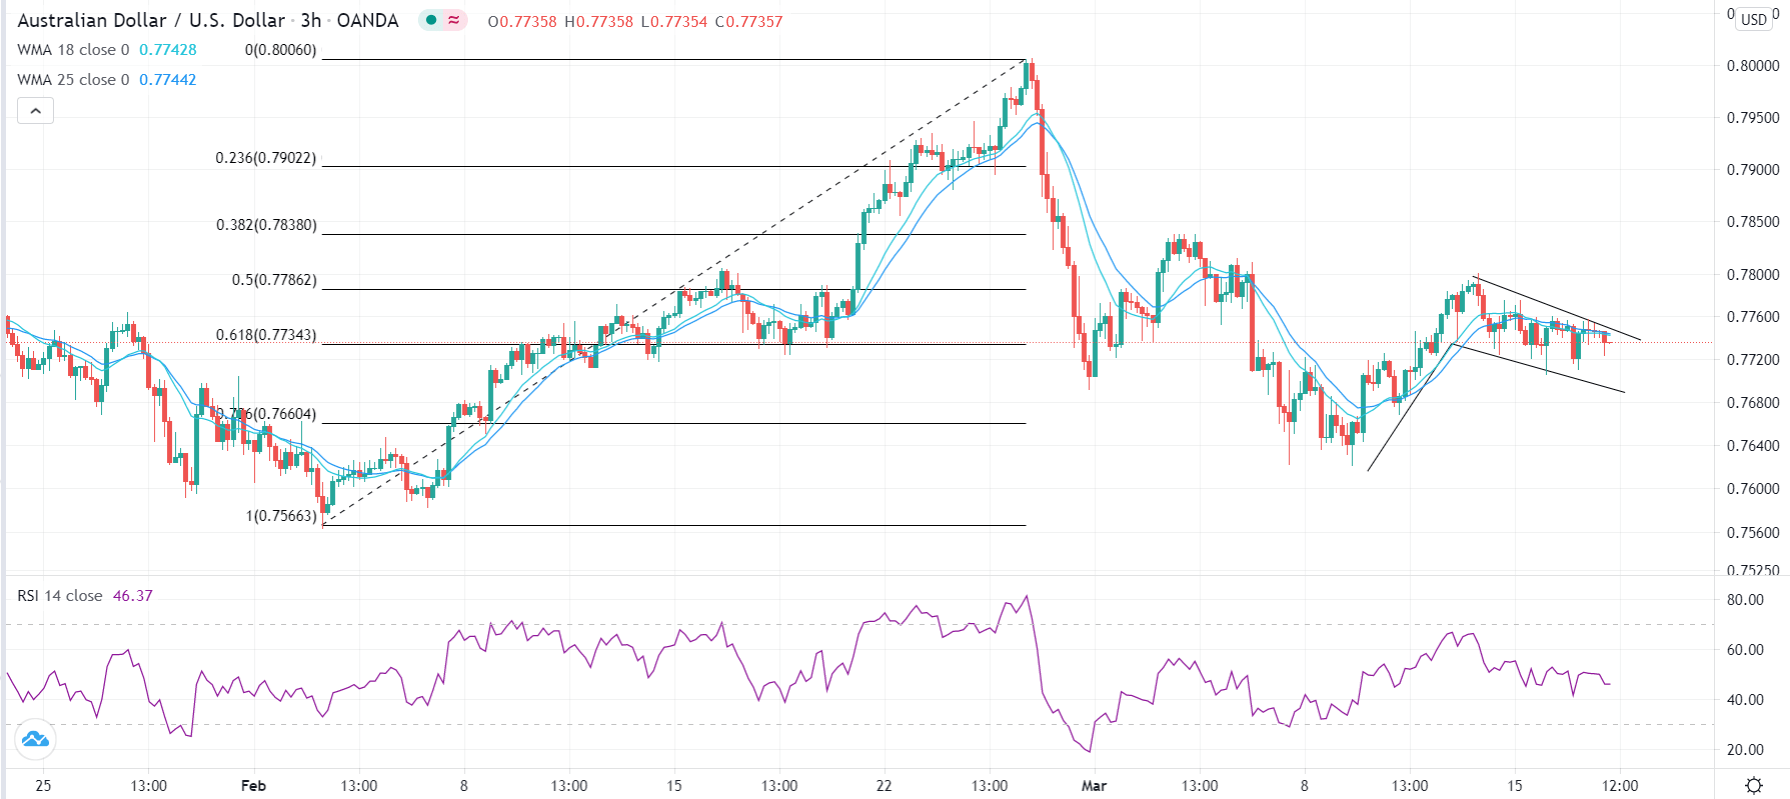
The AUD/USD price has formed a bullish flag pattern ahead of the FOMC decision and Australian employment numbers scheduled for tomorrow.
Australian Jobs Data
The AUD/USD has been relatively under pressure recently because of the stronger US dollar and weak commodity prices. The US Dollar Index has risen to $91.93 while the Bloomberg Commodity Index (BCOM) has declined to $85.85. The Aussie is viewed as a proxy for commodities because of the vast amount of natural resources that Australia has. Further, the falling bond yields in Australia have been relatively bearish for the AUD.
There is no scheduled economic release from Australia today. Therefore, focus will be on the country’s employment numbers that are scheduled for tomorrow morning. In general, economists polled by Reuters expect these numbers to reveal that the overall unemployment rate declined from 6.4% to 6.3%. They also expect the participation rate will rise from 66.1% to 66.2% while the economy added more than 30,000 jobs.
The Australian economy will generally recover better than most countries because of the surging demand from China.
As all currency majors, the AUD/USD will react to the latest US housing starts and building permits numbers scheduled for later today. Economists predict that housing starts declined from 1.58 million to 1.56 million while building permits fell from 1.88 million to 1.75 million.
While the housing numbers are important, the focus will be on the Fed decision set for later today. Based on the Fed’s forward guidance, there will be no policy changes today. A hawkish Fed will likely be bearish for the AUD/USD pair.
AUD/USD Technical Forecast
The AUD/USD price rose from last week’s low of 0.7619 and reached a high of 0.7797 on Friday. Since then, the pair has formed a bearish flag pattern that is shown in black. In technical analysis, a flag pattern is usually a sign of continuation.
This means that there is a possibility that it will break-out higher and move above the important resistance at 0.7800. If this happens, the next key level to watch will be 0.7840, which is along the 38.2% Fibonacci retracement level. However, a decline below 0.7680 will invalidate the bullish flag thesis.


