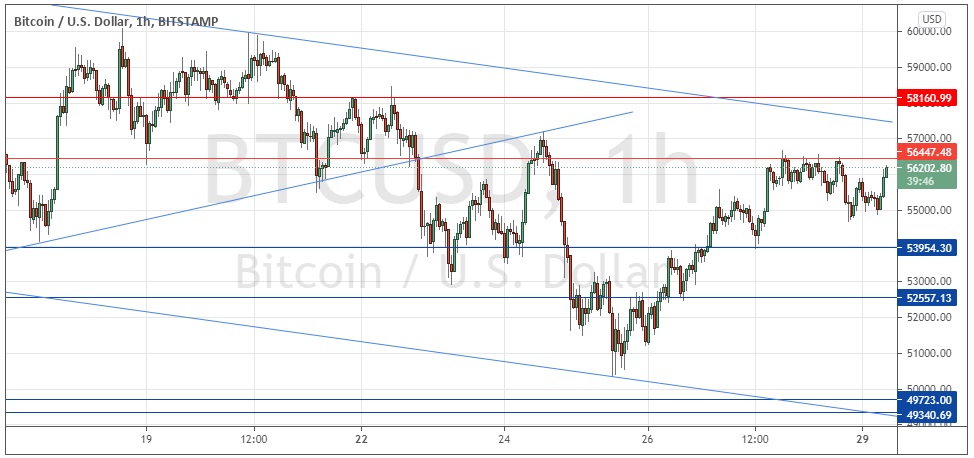
Last Wednesday’s Bitcoin signals were not triggered as both the bullish and bearish price action took place beyond the key support and resistance levels.
Today’s BTC/USD Signals
Risk 0.50% per trade.
Trades must be taken before 5pm Tokyo time Tuesday.
Long Trade Ideas
Go long after a bullish price action reversal on the H1 time frame following the next touch of $53,954 or $52,557.
Place the stop loss $100 below the local swing low.
Move the stop loss to break even once the trade is $100 in profit by price.
Take off 50% of the position as profit when the trade is $100 in profit by price and leave the remainder of the position to run.
Short Trade Ideas
Go short after a bearish price action reversal on the H1 time frame following the next touch of $56,448, the descending trend line shown in the price chart below which is currently sitting at approximately $57,450, or $58,161.
Place the stop loss $100 above the local swing high.
Move the stop loss to break even once the trade is $100 in profit by price.
Take off 50% of the position as profit when the trade is $100 in profit by price and leave the remainder of the position to run.
The best method to identify a classic “price action reversal” is for an hourly candle to close, such as a pin bar, a doji, an outside or even just an engulfing candle with a higher close. You can exploit these levels or zones by watching the price action that occurs at the given levels.
BTC/USD Analysis
I wrote last Wednesday that I saw bears as most likely to have the edge over the day, so I thought that being ready to take a short trade from a bearish reversal at either of the nearby resistance levels as being the best opportunity which may set up, especially the lower one at $56,448.
I was correct about Wednesday being a down day, as the price closed in New York well down at around $51k. However, I was wrong about the resistance level near $56k holding as it was exceeded by about $600 before the price took a dive.
The broad technical picture remains unchanged despite all the price movement we have seen here over recent days. We still have a wide bearish channel which is holding the price, but the very wide and continuous swings that we are seeing within that channel are helping to mask the bearish picture.
It may be that the bullish push we have seen over recent hours will succeed in forcing a breakout soon beyond the upper channel trend line and the resistance level just above it at $58,161.
If the price makes a bearish failure in that area after attempting to rise, that will give a technically attractive short trade opportunity which could produce a meaningful profit due to the large width of the price channel.
If we get two consecutive hourly closes above $58,161 later, that will be a bullish sign signalling higher prices are more likely than not to happen quickly.
There is nothing of high importance due today regarding the USD.


