Bullish View
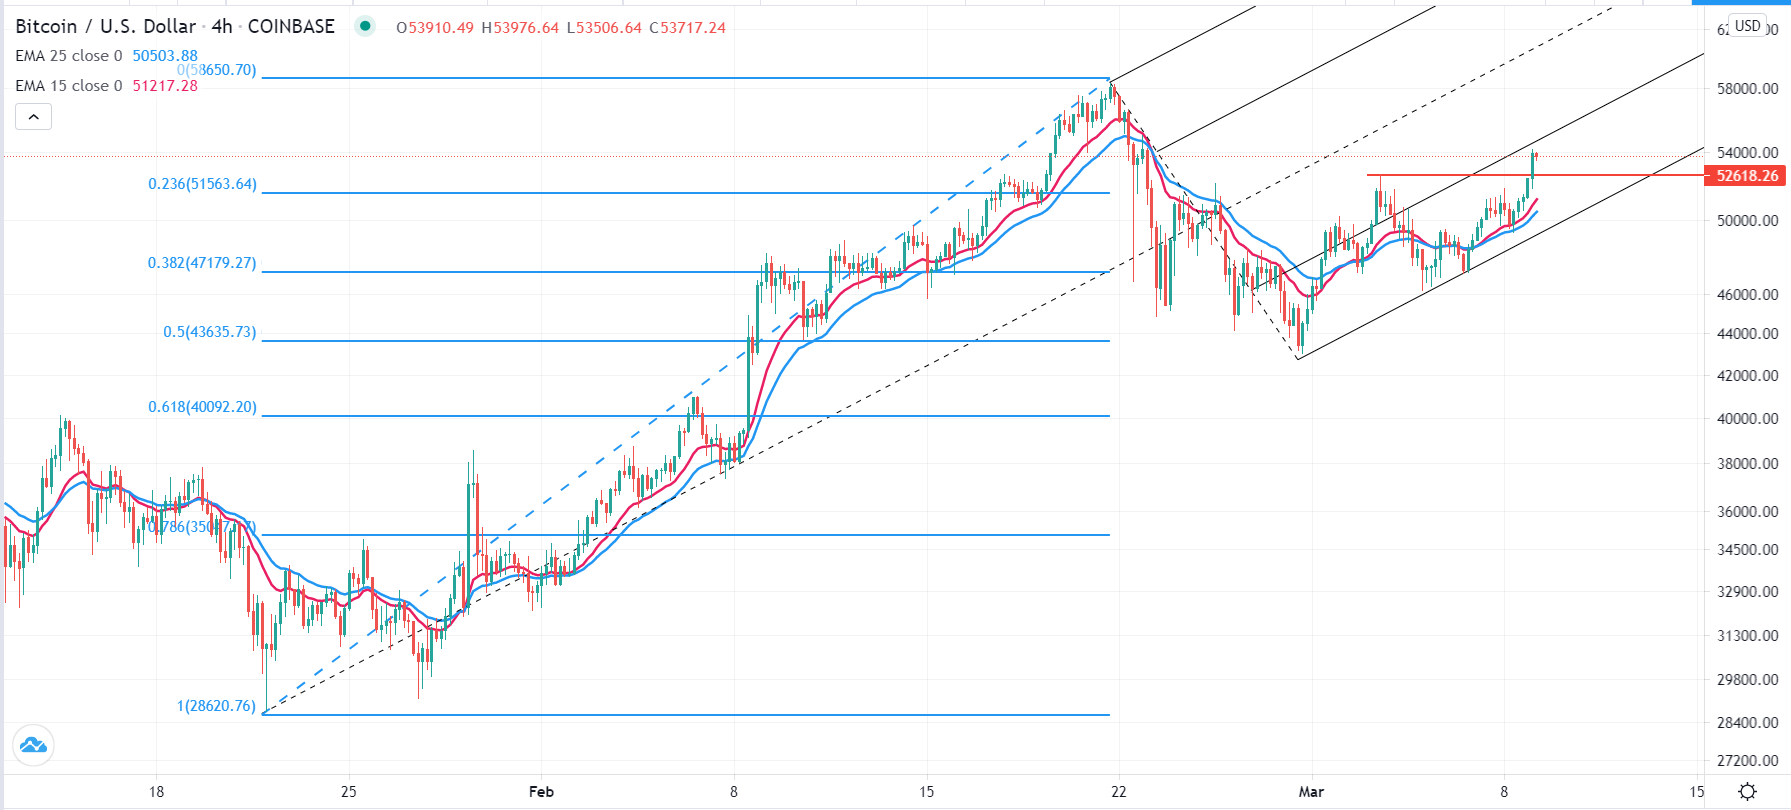
Buy the BTC/USD above the 52,618 level.
Add a take-profit at 54,000 and a stop loss at 51,000.
Timeline: 1-2 days.
Bearish View
Set a sell-stop at 51,000 and a take-profit at 50,000.
Add a stop loss at 52,000.
The BTC/USD price has bounced back as US Treasury yields erase some of the gains made yesterday. The Bitcoin price is trading at $53,960, which is 25% above the February low of $43,058.
Bitcoin Breaks Out
Bitcoin has been relatively volatile recently. After reaching its all-time high of above $58,000 in February, the price crashed to $43,000 in February. Since then, it has been attempting to bounce back as more investors rush to buy the dips.
The recent weakness was mostly because of profit-taking after the currency rose by more than 100% this year. It was also because of the recent sell-off of US Treasury bonds. In the past few weeks, the yields of all US government bonds have risen to the highest level in more than 1 year. Yields are inverse to prices.
The yields rose as investors started to price-in further economic recovery in the United States as Congress deliberated on the stimulus package. While the $1.9 trillion stimulus is generally good for the economy, it also raises the possibility of high-interest rates earlier than expected.
Indeed, analysts expect that data by the statistics bureau will show that the headline consumer inflation rose to 1.7% in February. The price of Bitcoin and other risky assets tends to underperform in periods of high-interest rates.
The stimulus is also good since some of the recipients of the funds will buy Bitcoin and other digital currencies. Furthermore, some of the biggest players in finance like Elon Musk and Jack Dorsey have already expressed their support for the currencies.
BTC/USD Technical Outlook
The BTC/USD price rallied to an all-time high of $58,327 in February. This price was more than 1,400% above its lowest level in 2020. The performance was mostly due to the easy money policies by the Federal Reserve and other global central banks.
On the four-hour chart, the price is slightly below the first support of the Andrews pitchfork tool. It has also moved above the 23.6% Fibonacci retracement level. Most importantly, it has moved above the previous resistance level of $52,618. Therefore, at this stage, the path of least resistance for the Bitcoin price is higher. The key levels to watch will be the psychological levels at $53,000 and $54,000.


