Bullish View
Buy the BTC/USD as the rally continues.
Have an initial target at 58,300, the all-time high.
Add a stop loss at 54,000.
Bearish View
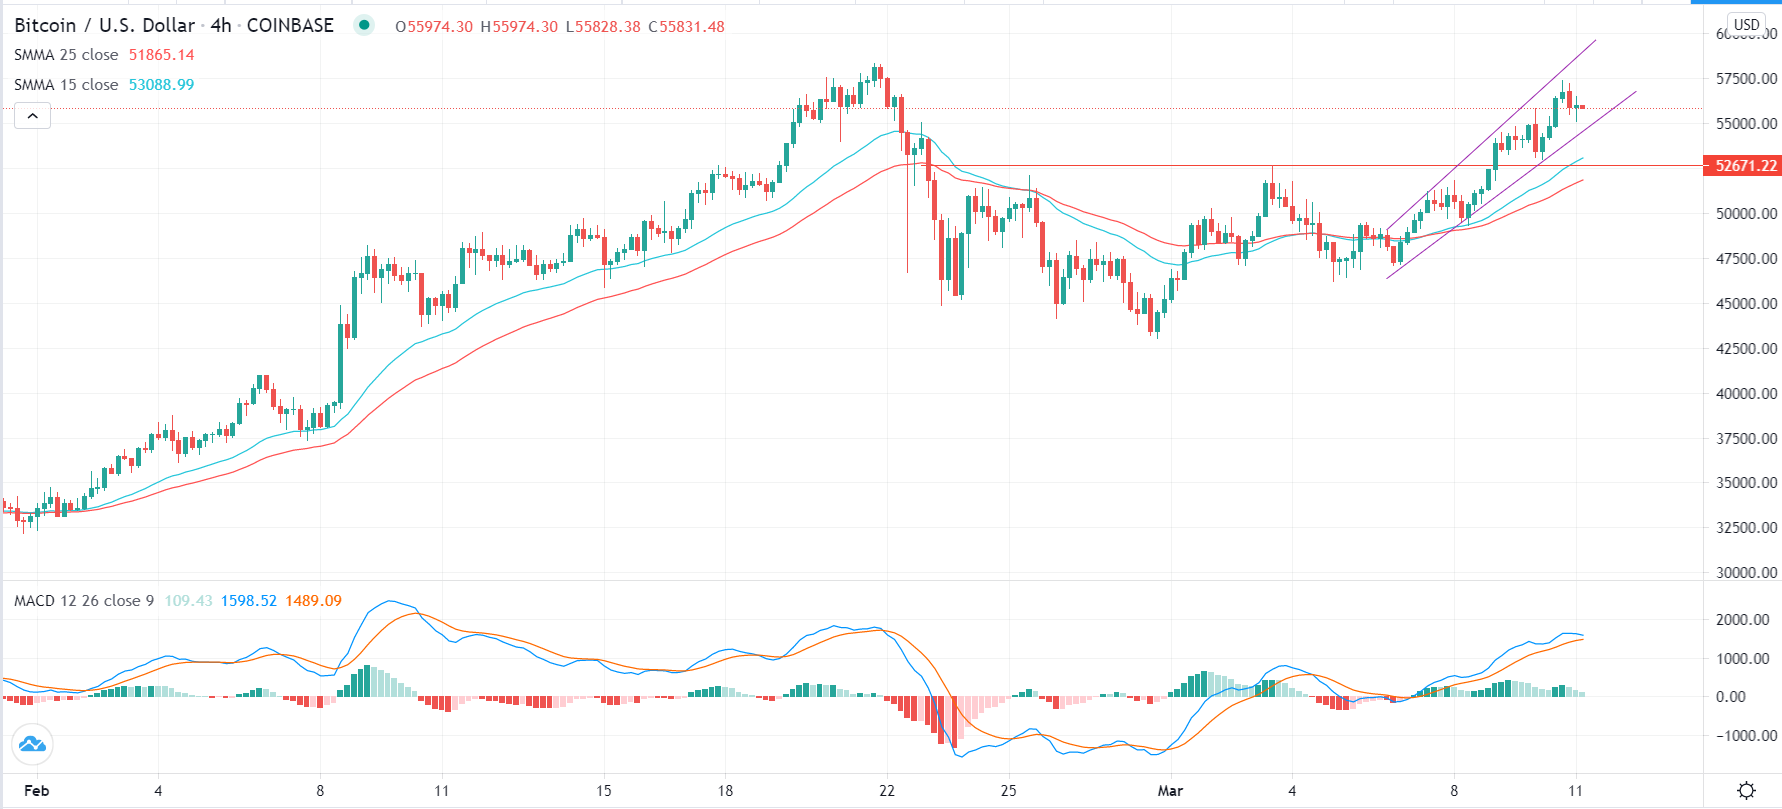
Set a sell-stop at 54,000 (slightly below the lower line of the channel).
Add a take profit at 52,621 (neckline of the inverted head & shoulders).
Set a stop loss at 56,000.
The BTC/USD price rebounded after the mild increase of US consumer prices and after the House of Representatives passed the final stimulus package. The Bitcoin price soared to $57,454, slightly below its all-time high of $58,600.
Bitcoin Price Rebounds
Bitcoin is having a good week. In the past few days, the price has jumped by more than 30% from last week’s low of $43,000 to more than $57,000.
Several things have contributed to this rally. First, as the price dropped, data shows that more large investors rushed to buy the dips. For example, MicroStrategy, the biggest holder of Bitcoins bought more coins last week in a sign of confidence in the currency.
Second, Bitcoin rose because many large holders did not sell as the price dropped. Companies like Tesla and Square continued to hold their coins even as Elon Musk lamented about the prices being expensive.
Third, the BTC/USD rallied overnight after the latest US inflation data. According to the Bureau of Labour Statistics, consumer prices rose from 0.3% in January to 0.4% in February. On an annual basis, they rose by 1.7%, which was in line with expectations. This increase was not as steep as what many analysts were expecting.
Finally, the House passed the $1.9 trillion stimulus package, meaning that the president will sign it into law this week. The package will provide $1,400 to individuals and boost unemployment insurance. Ideally, many people who will receive these funds will buy cryptocurrencies with it. Therefore, this will likely lead to more demand for BTC and other currencies.
However, the challenge is that the stimulus will lead to higher inflation, which could lead to higher interest rates. Higher rates tends to have negative impacts on risk assets like Bitcoin and gold.
BTC/USD Technical Outlook
The BTC/USD price has been on a strong upward trend lately. On the four-hour chart, the price has moved above the neckline of the inverted head and shoulders pattern. It is also being supported by the 25-period and 15-period smoothed moving averages.
The moving average convergence and divergence (MACD) has also continued to rise. It has also formed an ascending channel pattern. Therefore, the overall trend is bullish and I suspect that the price will retest the all-time high at $58,300 in the near term.

