Bearish Signal
Sell the BTC/USD below 53,624 (first support of pivot points).
Add a take-profit at 47,900 (second support).
Set a stop-loss at 54,500.
Bullish Signal
Set a buy stop at 53,700 and a take profit at 55,000.
Set a stop loss at 52,000.
The BTC/USD declined sharply as interest in the digital currency faded and as the US bond yields rose after falling for the past three days. The Bitcoin price is trading at $51,900, which is 15.8% below the all-time high of $61,866.
Bitcoin Price Under Pressure
The BTC/USD dropped even after some good news this week. In a recent statement, Tesla, the biggest automaker in the world by market cap, said that it will start accepting payments through Bitcoin. This is important since it means that more businesses will likely start accepting the digital currency going forward.
In another report, Fidelity, one of the biggest financial companies in the US said that it would soon launch a Bitcoin ETF that will track the Fidelity Bitcoin Index. If approved by the Securities and Exchange Commission (SEC), the ETF will be a cheaper option for institutional investors to invest in the currency.
Today, one of their preferred routes is to use the Grayscale Bitcoin Trust, which is widely known for its high fees. Past attempts to create a Bitcoin ETF by companies like VanEck have failed.
The BTC/USD is also falling after a sudden rebound of US bond yields. After falling for the past three days, the yields bounced back in the American session. The yield of the 10-year has risen from to 1.68%, which is above this week’s low of 1.55%. The 30-year and 2-year yields have also risen to 2.33% and 0.14%. This is probably a sign that investors expect inflation to creep-up and force the Fed to hike rates.
BTC/USD Technical Outlook
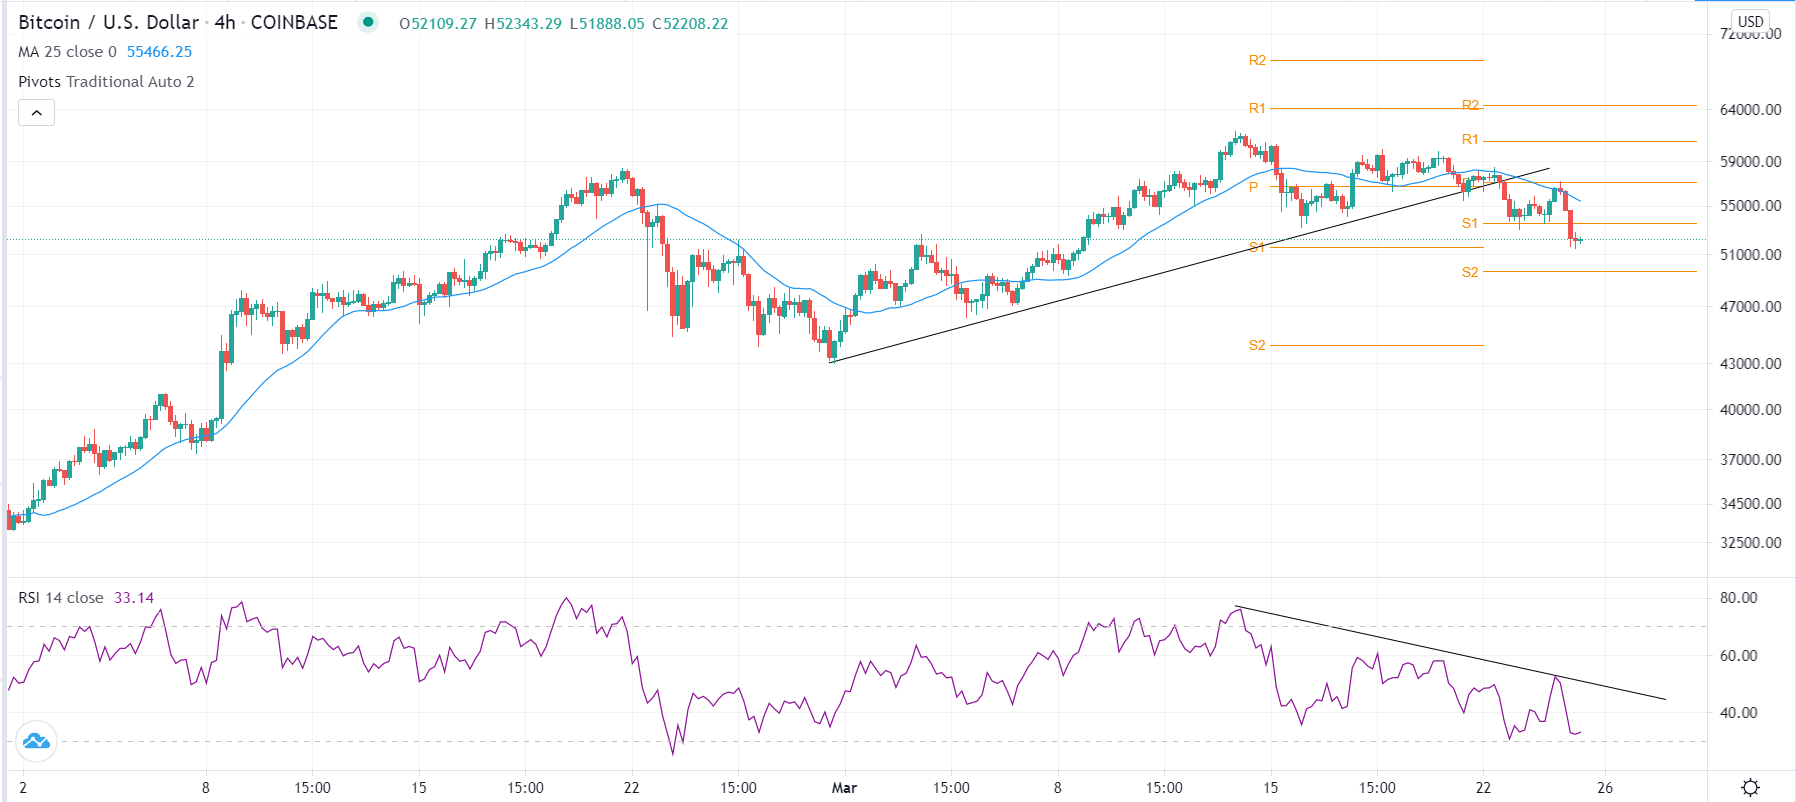
The four-hour chart shows that the BTC/USD pair rose to $61,700 in February this year. Since then, the pair has struggled to move above its all-time high. This week, it moved below the ascending trendline that is shown in black. It has also moved below the 25-day and 50-day exponential moving averages (EMA).
At the same time, the Relative Strength Index (RSI) has been on a strong downward trend. It has also moved below the first support of the standard pivot points. Therefore, as the sell-off intensifies, the next key level to watch is the second support at $49,700, which is 4% below the current level. However, a move above this week’s high of $57,000 will invalidate the bearish case.


