Last Wednesday’s Bitcoin signals were not triggered, as the bullish price action took place below $54,876 and there was no bearish price action at either of the key resistance levels identified when they were first reached.
Today’s BTC/USD Signals
Risk 0.50% per trade.
Trades must be taken before 5pm Tokyo time Tuesday.
Long Trade Ideas
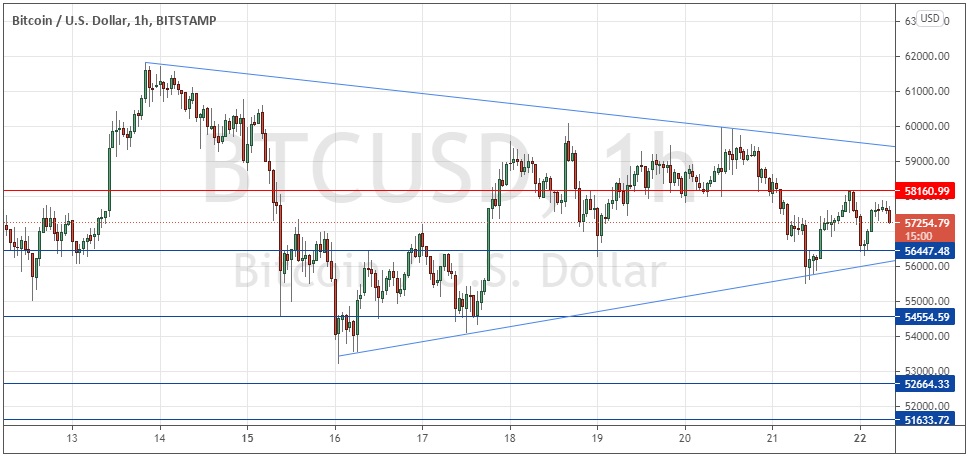
Go long after a bullish price action reversal on the H1 time frame following the next touch of $56,447, $54,555, or $52,664.
Place the stop loss $100 below the local swing low.
Move the stop loss to break even once the trade is $100 in profit by price.
Take off 50% of the position as profit when the trade is $100 in profit by price and leave the remainder of the position to run.
Short Trade Idea
Go short after a bearish price action reversal on the H1 time frame following the next touch of $58,161.
Place the stop loss $100 above the local swing high.
Move the stop loss to break even once the trade is $100 in profit by price.
Take off 50% of the position as profit when the trade is $100 in profit by price and leave the remainder of the position to run.
The best method to identify a classic “price action reversal” is for an hourly candle to close, such as a pin bar, a doji, an outside or even just an engulfing candle with a higher close. You can exploit these levels or zones by watching the price action that occurs at the given levels.
BTC/USD Analysis
I wrote last Wednesday that we were likely to see a consolidation between $57,223 and $52,664, meaning the best trading opportunities were likely to be from reversals at either level.
I also saw a bearish head and shoulders pattern emerging with a neckline at approximately $53K, so a bearish breakdown below that round number area would be significant.
We did not get a breakdown below $53K, and my forecast of consolidation continuing was wrong in the sense that as the price got above the presumed upper boundary at $57,223 quite quickly.
However, my expectation of consolidation has remained true in another sense as can be seen from the narrowing triangle holding the price in the price chart below.
I think whichever side of the triangle the price breaks out from first is likely to see a significant follow through. If the breakdown is bearish, that will likely signal that this bullish push up to new record highs has finished for several weeks or months. Alternatively, if the price makes a bullish breakout and clears the big round number at $60K, that will likely indicate a sustained bullish move up to new all-time highs.
I will take a bullish bias if we get two consecutive hourly closes above $60k today. I will be more cautious over a bearish breakdown, wanting to see the downwards movement clearing $53K before taking a bearish bias.
There is nothing of high importance scheduled for today regarding the USD.


