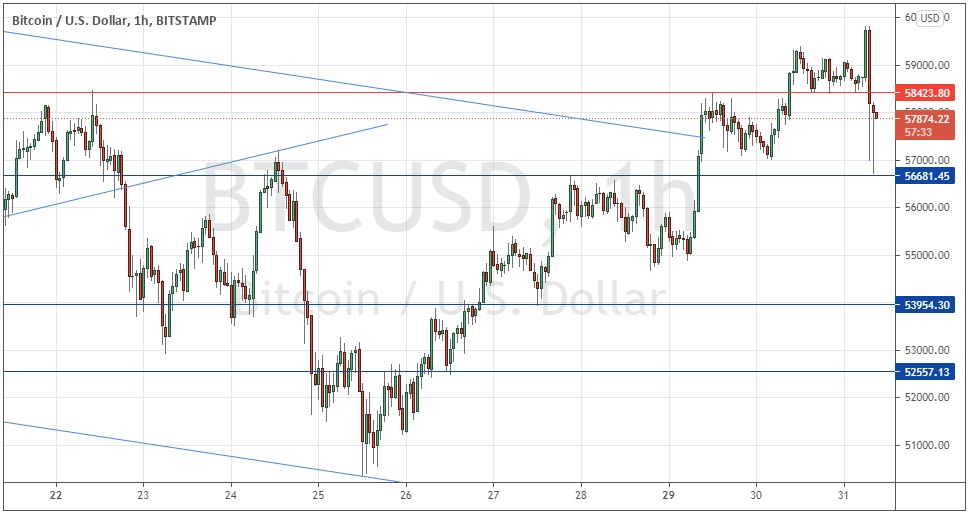
Last Monday’s Bitcoin signals may have produced a losing short trade from the weakly bearish price action at the resistance level of $58,161.
Today’s BTC/USD Signals
Risk 0.50% per trade.
Trades may only be entered prior to 5pm Tokyo time Thursday.
Long Trade Ideas
Long entry after a bullish price action reversal on the H1 time frame following the next touch of $56,681 or $53,954.
Put the stop loss $100 below the local swing low.
Adjust the stop loss to break even once the trade is $100 in profit by price.
Remove 50% of the position as profit when the trade is $100 in profit by price and leave the remainder of the position to ride.
Short Trade Idea
Short entry after a bearish price action reversal on the H1 time frame following the next touch of $58,424.
Put the stop loss $100 above the local swing high.
Adjust the stop loss to break even once the trade is $100 in profit by price.
Remove 50% of the position as profit when the trade is $100 in profit by price and leave the remainder of the position to ride.
The best method to identify a classic “price action reversal” is for an hourly candle to close, such as a pin bar, a doji, an outside or even just an engulfing candle with a higher close. You can exploit these levels or zones by watching the price action that occurs at the given levels.
BTC/USD Analysis
I wrote last Monday that the bullish push we had seen over recent hours would succeed in forcing a breakout beyond the upper channel trend line and the resistance level just above it at $58,161.
I therefore thought that two consecutive hourly closes above $58,161 would be a good bullish signal.
This was a good call insofar as it ensured anyone would keep out of trouble as we did not get two consecutive hours closing above $58,161, which basically held as resistance over the day.
The bullish push I noted Monday had continued until just a couple of hours ago as the price had been rising and printing higher stairstep support levels until it was trading just below $60k, not far below the all-time high made earlier this month above $61k. However, we have now seen a sudden, sharp drop in the price, which found support at $56,681.
I see this sudden high volatility drop as signalling that directional movement has become very unpredictable, so I think it will be wise to stand aside from any trend trades and instead look to trade any reversals at extremes.
Due to the current overall price movement, extremes effectively mean support levels. So, I would look for a long trade from a fast bounce at either $56,681 again or $53,954.
I do not expect the price to get above its all-time high near $61k today.

Concerning the USD, there will be a release of the ADP Non-Farm Employment Payrolls forecast at 1:15pm London time.
