Today’s BTC/USD Signals
Risk 0.50% per trade.
Trades must be taken before 5pm Tokyo time Tuesday.
Long Trade Ideas
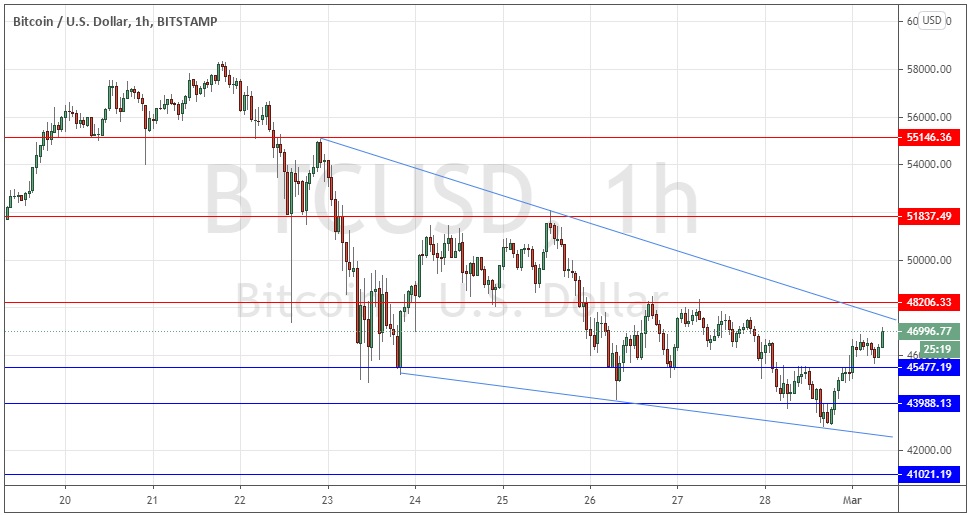
Go long after a bullish price action reversal on the H1 time frame following the next touch of $45,477 or $43,988.
Place the stop loss $100 below the local swing low.
Move the stop loss to break even once the trade is $100 in profit by price.
Take off 50% of the position as profit when the trade is $100 in profit by price and leave the remainder of the position to run.
Short Trade Ideas
Go short after a bearish price action reversal on the H1 time frame following the next touch of $48,207 or $51,837.
Place the stop loss $100 above the local swing high.
Move the stop loss to break even once the trade is $100 in profit by price.
Take off 50% of the position as profit when the trade is $100 in profit by price and leave the remainder of the position to run.
The best method to identify a classic “price action reversal” is for an hourly candle to close, such as a pin bar, a doji, an outside or even just an engulfing candle with a higher close. You can exploit these levels or zones by watching the price action that occurs at the given levels.
BTC/USD Analysis
It has been barely one week since Bitcoin peaked at an all-time high price in USD above $58K. Since then, we have seen an inevitable strong sell-off after a very overextended run that, it must be said, was becoming a speculative bubble.
Dedicated believers in Bitcoin as a store of value were believing that Bitcoin was going to just continue advancing to $100K and beyond. Just as more and more people were beginning to believe this, unsurprisingly, is when we got this sharp drop of approximately 25% in value.
The technical picture now is one of a burst bullish bubble which is now forming a medium-term bearish wedge pattern, which can be clearly seen in the price chart below. It is worth noting that the bubble could inflate again quickly.
Despite the broadly bearish situation, recent hours have seen a recovery in riskier assets in the market, and Bitcoin is no exception.
The crucial thing to watch out for now technically is whether the price can get established above the upper trend line of the bearish wedge which is currently containing the price – if so, this will be a bullish sign. However, I would want to see the price get higher than that as there is higher potential resistance in the area, not to mention the huge psychological round number at $50K.
I will take a bullish bias on Bitcoin if get two consecutive hourly closes above $50k, or a bearish bias if we get the same below $42K.
Concerning the USD, there will be a release of ISM Manufacturing PMI data at 3pm London time.

