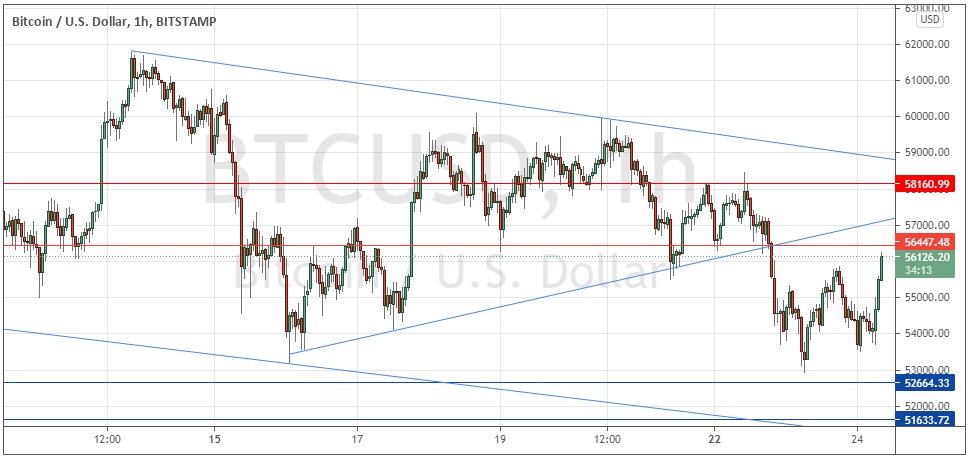
Last Monday’s Bitcoin signals produced a nicely profitable short trade from the bearish inside candlestick breakdown on the hourly chart which rejected the resistance level at $58,161.
Today’s BTC/USD Signals
Risk 0.50% per trade.
Trades may only be entered prior to 5pm Tokyo time Thursday.
Long Trade Ideas
Long entry after a bullish price action reversal on the H1 time frame following the next touch of $52,664 or $51,634.
Put the stop loss $100 below the local swing low.
Adjust the stop loss to break even once the trade is $100 in profit by price.
Remove 50% of the position as profit when the trade is $100 in profit by price and leave the remainder of the position to ride.
Short Trade Idea
Short entry after a bearish price action reversal on the H1 time frame following the next touch of $56,448 or $58,161.
Put the stop loss $100 above the local swing high.
Adjust the stop loss to break even once the trade is $100 in profit by price.
Remove 50% of the position as profit when the trade is $100 in profit by price and leave the remainder of the position to ride.
The best method to identify a classic “price action reversal” is for an hourly candle to close, such as a pin bar, a doji, an outside or even just an engulfing candle with a higher close. You can exploit these levels or zones by watching the price action that occurs at the given levels.
BTC/USD Analysis
I wrote last Monday that whichever side of the triangle the price broke out from first was likely to see a significant follow through. If the breakdown were bearish, that would likely signal that this bullish push up to new record highs has finished for several weeks or months.
I was more cautious over a bearish breakdown, wanting to see the downwards movement clearing $53k before taking a bearish bias.
This was a good and accurate call as the bearish breakdown, when it came, produced a sustained bearish price movement which went all the way to $53k, a level I have been highlighting over recent days as likely to be very pivotal. We saw buying there and it must be noted that my signal gave a short trade entry at $54,563 allowing a profitable ride down of about 2%, although right now the price is higher than that entry point.
Although we have seen buying at $53k, if the price can not get back up into the zone represented by the remainder of the triangle shown within the price chart below, we are unlikely to see the bulls test the all-time high again above $60k any time soon.
The chart below shows that we have a valid but wide symmetrical bearish price channel, which is another bearish sign.
I see bears as most likely to have the edge today, so I think being ready to take a short trade from a bearish reversal at either of the nearby resistance levels as being the best opportunity which may set up, especially the lower one at $56,448 which should hold if the environment is truly as bearish as I think it is.
Concerning the USD, there will be a release of Flash Manufacturing PMI data at 1:45pm followed 15 minutes later by the Chair of the Federal Reserve testifying before the Senate Banking Committee.


