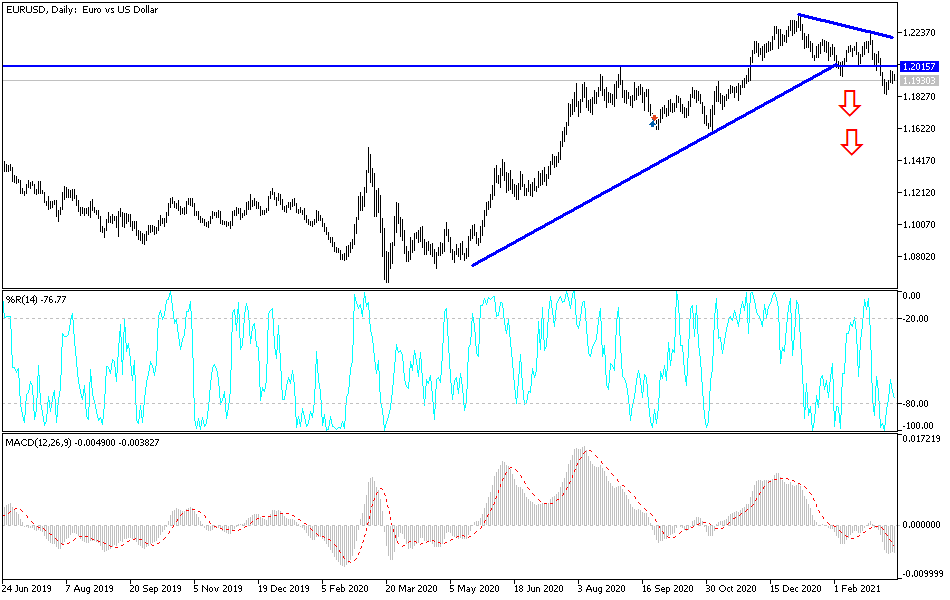
Bullish View
Buy the EUR/USD above 1.1930 (middle Bollinger Band and 23.6% retracement).
Have a take-profit at 1.2020 (R1 of standard pivot points).
Add a stop loss at 1.1900.
Bearish View
Set a sell-stop at 1.1890.
Add a take-profit at 1.1862 (S1 of standard pivot point).
Set a stop-loss at 1.1950.
The EUR/USD price is little changed as investors continue to reflect on the recent stimulus deal and inflation data. Focus now shifts to the upcoming Federal Reserve (Fed) interest rate decision scheduled for Wednesday this week.
Stimulus and Inflation in Focus
The EUR/USD is steady after data released last week revealed that inflation fears were not as severe as was expected. On Wednesday, data by the Bureau of Labour Statistics (BLS) revealed that the overall Consumer Price Index (CPI) increased from 1.4% in January to 1.7% in February.
On Friday, the bureau said that the Producer Price Index (PPI) rose by 0.5% in February, helped by energy prices. These numbers revealed that the pace of price increase was not as much as most analysts were expecting. On Sunday, Treasury Secretary Janet Yellen said that there was a small risk of inflation but it was manageable.
In general, analysts expect that consumer prices will rise sharply in the next few months because of the recent $1.9 trillion stimulus package. They also expect the rate will start declining as the impacts of the stimulus start to fade.
Looking ahead, the EUR/USD will react to the Fed interest rate decision scheduled for Wednesday this week. In general, analysts, based on the previous Fed guidance, expect that the bank will leave the interest rate unchanged at the current range of 0% to 0.25%. They also expect that the bank will continue with its asset purchases. This decision will come a week after the European Central Bank (ECB) left rates and QE unchanged.
EUR/USD Technical Signal
The EUR/USD is trading at 1.1950. On the four-hour chart, this price is between the 23.6% and 38.2% Fibonacci retracement level. It is also slightly between the middle and the upper lines of the Bollinger Bands. The fast and slow lines of the MACD have also moved slightly above the neutral level.
Therefore, the upward trend will remain so long as the price is above the middle line of the Bollinger Bands. If the bullish trend holds, the next key level to watch is 1.2020, which is the first resistance of the standard pivot points. It is also slightly below the 50% Fibonacci retracement level.


