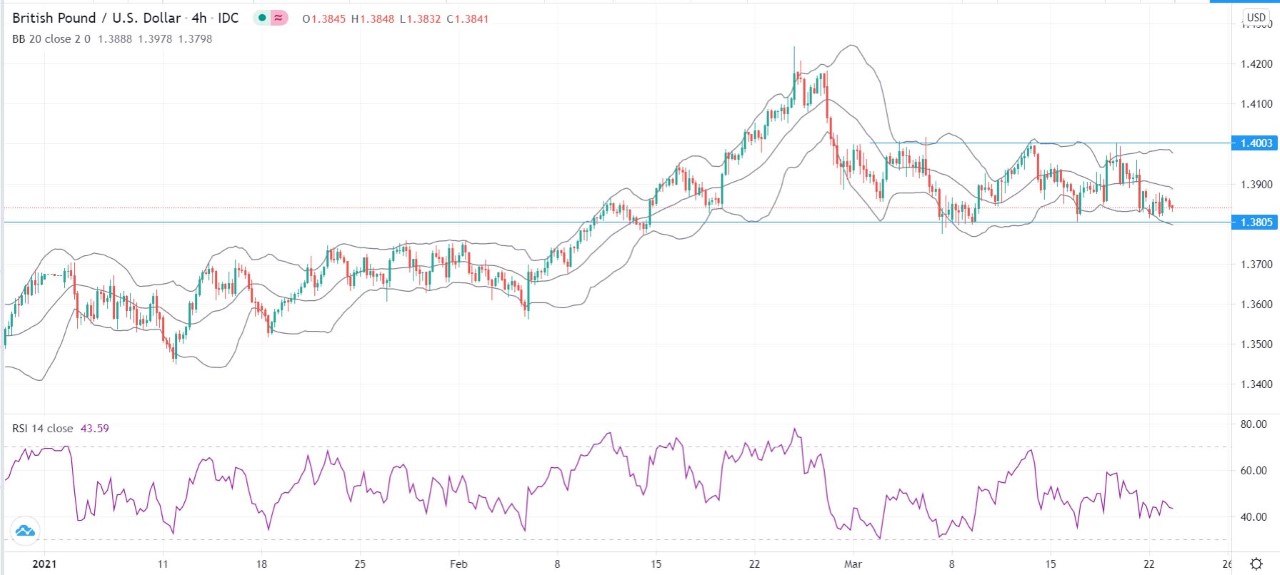
Bearish view
- Set a sell stop at 1.3800 (below the lower side of the rectangle).
- Add a take-profit at 1.3750 and a stop loss at 1.3850.
Bullish view
- Set a buy stop at 1.3900 (middle Bollinger Band).
- Add a take profit at 1.4000 (upper side of the rectangle).
- Set a stop loss at 1.3850.
The GBP/USD is under pressure ahead of the latest UK jobs numbers and the US new home sales numbers. It is trading at 1.3840, which is 1.15% below last week’s high of 1.4000.
UK jobs numbers ahead
Like all economies, the UK’s labor market has suffered greatly because of the coronavirus pandemic. Millions of people have lost their jobs as many companies like Arcadia Group and Thornton have gone bankrupt. Many companies like Rolls-Royce Holdings and IAG have announced substantial layoffs.
The Office of National Statistics (ONS) will publish the latest UK jobs data at 07:00 GMT. Analysts expect these numbers to show that the overall unemployment rate rose from 5.1% in December to 5.2% in January as the country battled the new wave of the pandemic.
Still, this figure will be slightly better than that of other countries. In January, the US unemployment rate was at 6.6% while the European rate was above 8%. This divergence is mostly because of the UK government’s furlough program that was recently expanded to September. In it, the government is paying 80% of salaries to most of the furloughed workers.
The GBP/USD will also react to the latest wages numbers. Analysts expect the data to show that earnings with wages increased from 4.7% in December to 4.9% in January. Without bonuses, they expect that the wages rose by 4.4%.
These numbers will come a day before the ONS is set to publish the latest UK inflation numbers. Economists expect the data to show that the overall CPI increased from -0.2% in January to 0.5% in February. This will translate to a 0.8% annualised growth. They also see the core CPI increasing from -0.5% to 0.5% and at an annual rate of 1.4%. This inflation will likely keep rising because of the rising price of crude oil and the ongoing recovery.
GBP/USD technical forecast
The GBP/USD pair has formed a rectangle pattern on the four-hour chart. The support and resistance levels of this triangle are at 1.3805 and 1.400. The current price is slightly above the lower side of this channel. It is also between the middle and lower lines of the Bollinger Bands. The Relative Strength Index (RSI) is also slightly above the oversold level of 30. Therefore, the outlook for the pair is neutral, with the key levels to watch being 1.3805 and 1.4000.


